10 Year Notes, 117.24, or 104.27

ONE44 Analytics where the analysis is concise and to the point
Our goal is to not only give you actionable information, but to help you understand why we think this is happening based on pure price analysis with Fibonacci retracements, that we believe are the underlying structure of all markets and Gann squares.
10 Year Notes
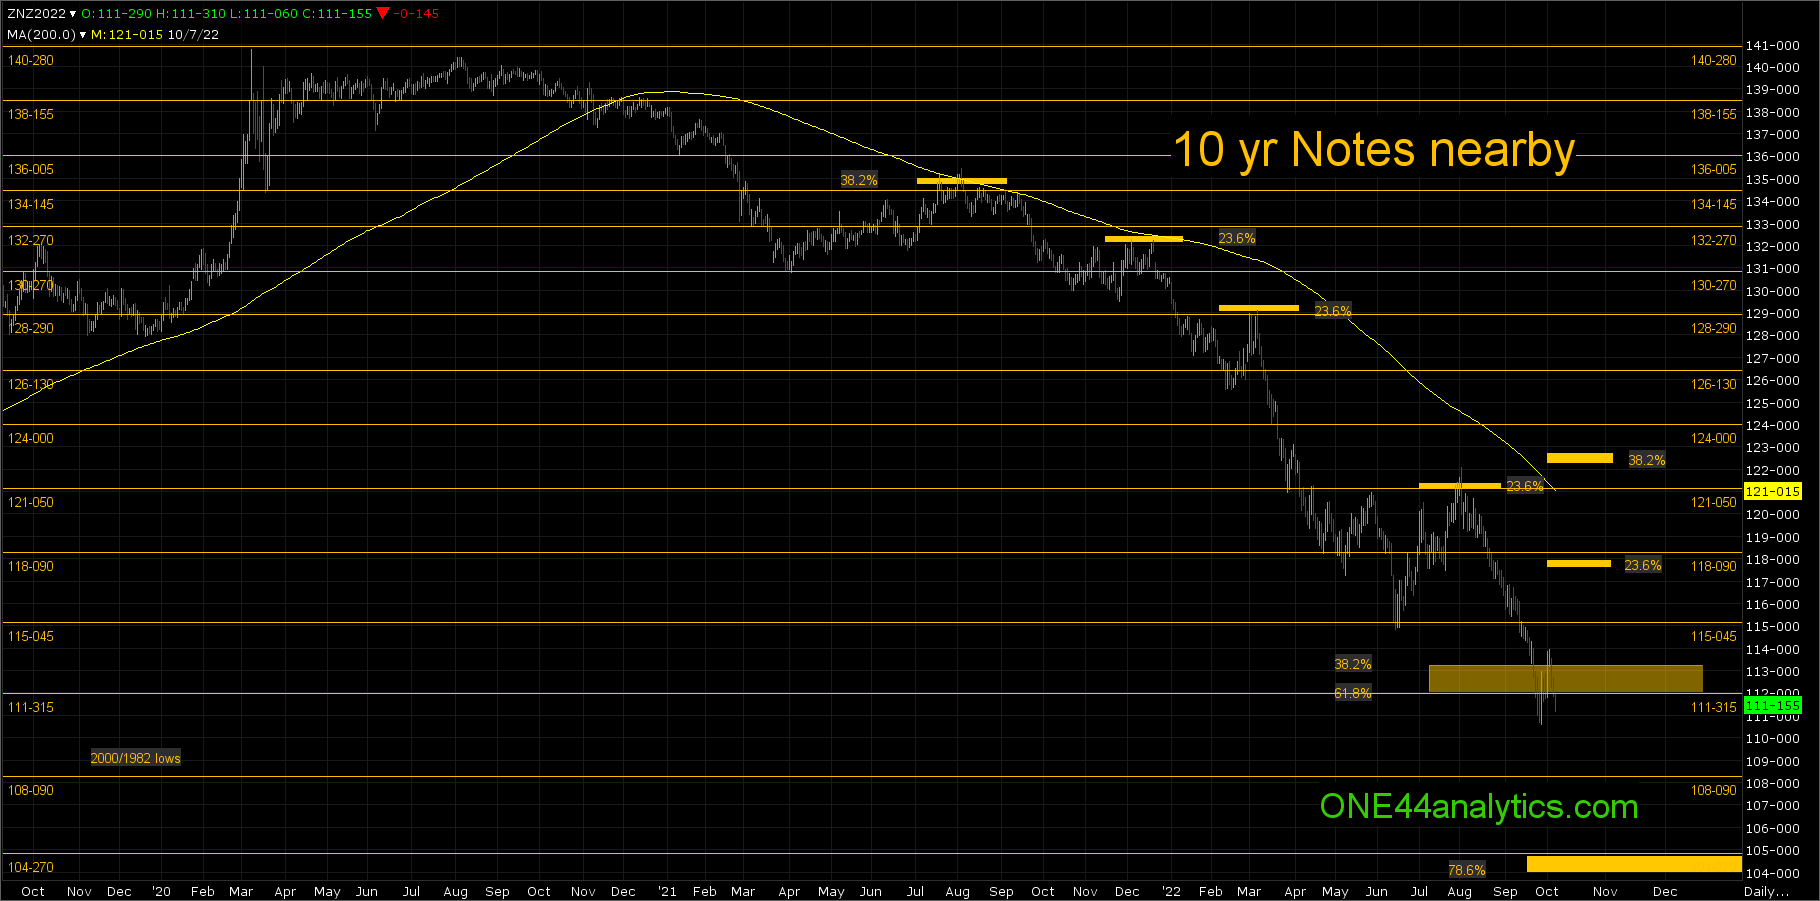
On the chart below you can see each of the attempts to rally after making the ATH have run into key retracements.
On 7/20/21 and again on 8/4/21 the rally hit 38.2% back to the high and following the ONE44 38.2% rule,
Of these, 38.2% is the single most important retracement and is the level we use for the "Golden Rule". This rule being, " any market that is going to keep its current trend must hold 38.2%". As long as it does the trend will continue and it should make new highs/lows from that retracement.
As you can see it went on to new lows and made another attempt to rally from the 11/24/21 low and hit 23.6% on 12/3/21 and 12/17/21 and following the ONE44 23.6% rule,
Extremely strong/weak markets will only go back 23.6%. This is Typically a runaway market.
The break from it took it to a new low and the next rally from the 2/11/22 low hit 23.6% again keeping this market extremely weak and the runaway break followed from 129.02 to 114.27. The low on 6/14/22 was a major Gann square and the rally from it went to 23.6% back to the ATH on 8/2/22, this was also a major Gann square. True to form the break from it took it to new lows and into some very long term retracements and this brings us to, "10 Year Notes, 117.24, or 104.27",
The long term retracements are 38.2% back to the 1982 low and 61.8% back to the 2000 low, these levels are 113.05 and 111.31, the second is also a major Gann square and more important. Friday's close was below it and if in the next couple days it can't get back above 113.05, look for 104.27, this is a major Gann square and 78.6% back to the 2000 low. Provided it can get back above 113.05 and because these are such long term levels the rally from it can be that much bigger, so the longer term target will be 38.2% back to the ATH, this is 122.08. The short term target will be the area of 117.22 (23.6% to ATH) and the 118.09 major Gann square.
Sign up for our Free newsletter here.
FULL RISK DISCLOSURE: Futures trading contains substantial risk and is not for every investor. An investor could potentially lose all or more than the initial investment. Commission Rule 4.41(b)(1)(I) hypothetical or simulated performance results have certain inherent limitations. Unlike an actual performance record, simulated results do not represent actual trading. Also, since the trades have not actually been executed, the results may have under- or over-compensated for the impact, if any, of certain market factors, such as lack of liquidity. Simulated trading programs in general are also subject to the fact that they are designed with the benefit of hindsight. No representation is being made that any account will or is likely to achieve profits or losses similar to those shown. Past performance is not necessarily indicative of future results.