About

Nick Ehrenberg
An accomplished and talented professional with over forty years of experience as a market analyst providing analysis for hedge funds and high net worth traders in the Grains, Bonds, Equity Indexes and Stocks.
Ehrenberg specializes in delivering real-time market analysis to traders via desk top and mobile devices. A Subject Matter Expert (SME) in W.D.Gann and Fibonacci, with a focus in analyzing and forecasting future market movements with consistent results. He has established discretionary trading strategies across futures markets with short to medium term hold times, while constantly researching and developing new trading strategies to evolve with changing market conditions.
To learn more about ONE44, contact us via email at [email protected]
Key to the site
Being this is a weekly update we give all the key levels to watch for the week using Fibonacci retracements and Major Gann squares. We set up scenarios to look for when a level holds, or fails based on these methods, so it is very important to know for yourself how to use them following the ONE44 rules and guidelines. The best way to get a better understanding of these methods is to read all the posts (even if not on Grains) and watch our YouTube videos, as we explain why we think what we think based on the rules and guidelines. It is also important to view all the charts, as they have the key levels marked on them, if there are extended moves.
Swing Point and how to use it
When we use a level as a swing point aside from the Short, Intermediate and Long term swing points, it means the level we are using is not one of the three, but still a key level to watch. As we do with the other swing points, we will give you what to look for above it, provided it holds and below when it fails to hold this level. It is the same if the swing point is a retracement or a major Gann square. This is not a level to run any retracements from, unless it ends up being the high, or low for the move. All retracements come from the extreme high and low of a move, be it a 5 minute chart, or up to a weekly chart. It is always best to start at the farthest points (highs and lows) to get the true sense of the trend and work your way back down to the tightest highs and lows.
Trend Table
The trend table is a quick look at the Long Term, Intermediate and Short term trend. It has the direction of the trend, the swing point that it must hold to keep that trend and the target we are looking for as long as the trend remains the same.
| Trend | Swing Point | Target | |
|---|---|---|---|
| Long Term | 1400.00 | 2003.00 | |
| Intermediate Term | 1551.00 | 1796.50 | |
| Short Term | 1723.00 | 1612.00 | |
| As of: 3/28/2022, 5:56:39 PM | |||
ONE44 Law of Vibration Charts
The ONE44 Static sup/res. levels are derived from a compilation of ONE44 proprietary tools and W.D. Gann's law of vibration. These levels will not change in a given day and could be the same for weeks. The market movement is what will change these levels. The long term static levels can even last for years.
Use each level as support and then resistance once taken out and the reverse when it starts as resistance. You can also use the next level as a target once it has taken out the previous level. The hourly charts are for short term trading in between the major Gann squares on the Daily charts and the long term Fibonacci levels.
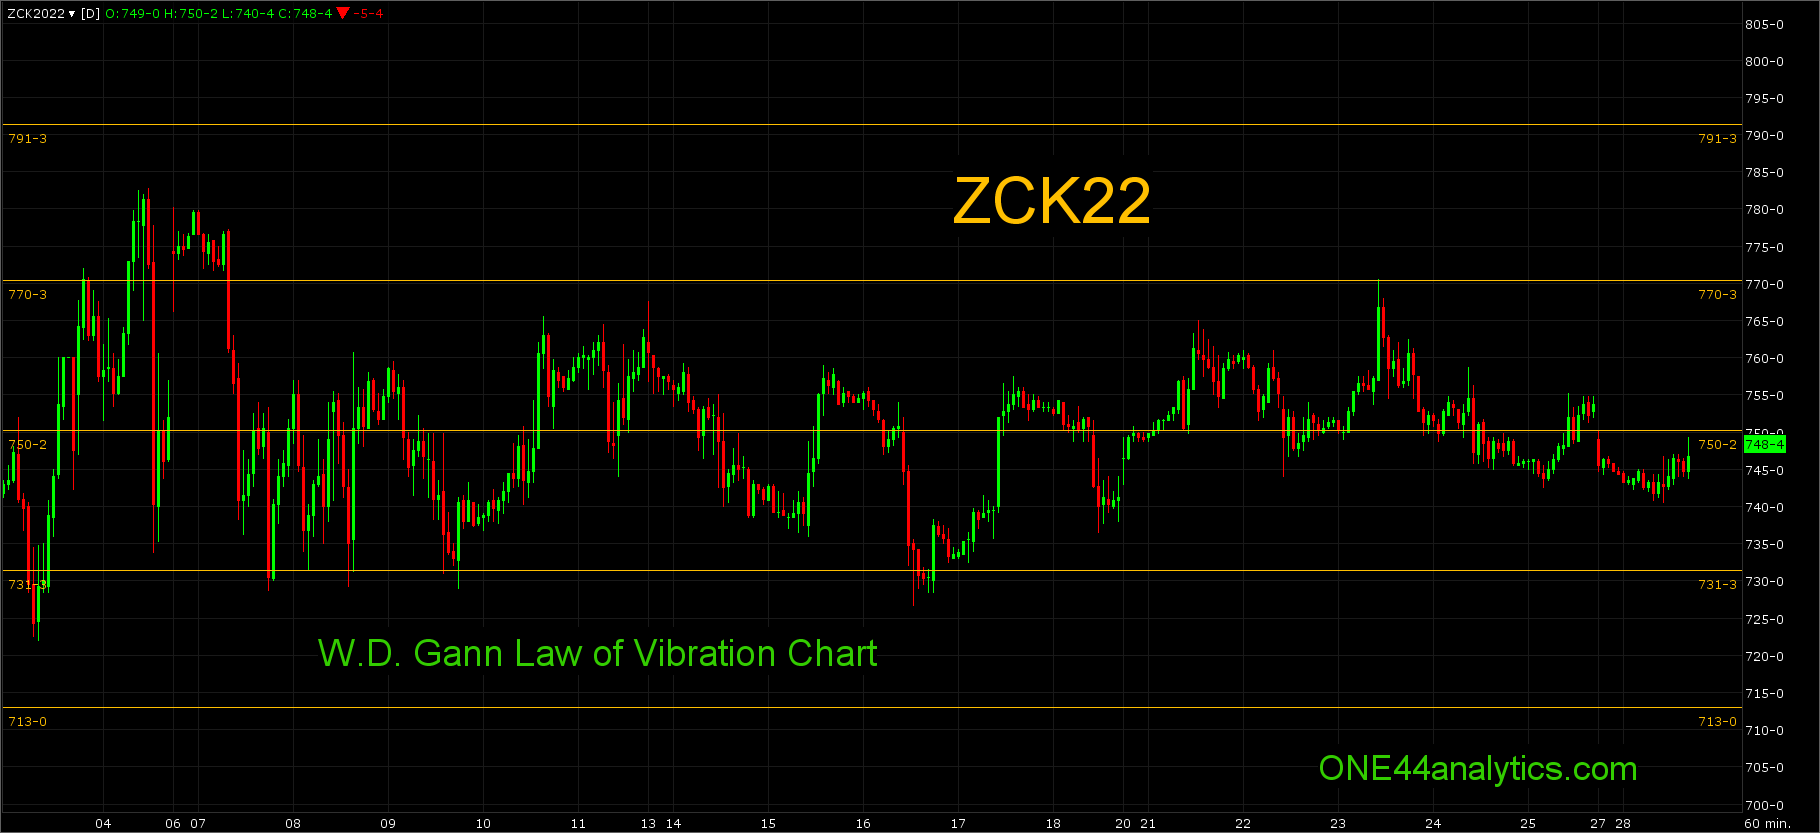
It is in these quotes that you can see what W.D. Gann believed...
"By knowing the exact vibration of each individual stock I am able to determine at what point each will receive support and what point the greatest resistance is to be met."Vibration is fundamental; nothing is exempt from this law; it is universal, therefore applicable to every class of phenomena on the globe. The issue with finding the exact vibration is, to quote W.D. Gann again, the market is "Wheels Within Wheels", or Cycles, To be even more accurate, it is cycles that take place within larger cycles in the market.Knowing this then we have to not only know the short term vibration, but the long term ones as well.
Our mission is to stay on top of these ever changing vibrations in the markets.The ONE44 Dynamic sup/res levels are formulated from 1x1 Gann angles, Moving averages, Swing Points and most importantly Fibonacci retracements, it is ONE44's belief that they are the "Underlying Structure of all Markets". Taking into consideration the above mentioned tools we produce the ONE44 swing point for the day, with this we give the upside and downside targets for when it holds and when it fails. Between the two types, we look to bring the best sup/res.
The longer term levels for the Static and Dynamic sup/res will be updated in a weekly outlook.
What violates a level?
When you get to a key levels based on the Fibonacci retracements, or Gann squares we always say it can trade below/above the level, but the close is key to it violating it. We also want to see a second close above/below to confirm it and if so, you can now use that level as the short term swing point and look for the target based on that retracements rule. ( we also want to see the second close lower than the first one below a key area and the reverse above a key area.) An example is, if it was 38.2% that was taken out the new target becomes 61.8% and when dealing with the Gann squares you look for the next one above/below. A failure to get that second close can have the same effect as if it held the level perfectly and the target from it would be the same. As an example, if it just closed below 38.2% and the next day closes right back above it, the target of new highs/lows for the move will be valid again and if it closed below/above 61.8% and then right back above it, we would be looking for 61.8% the other way.
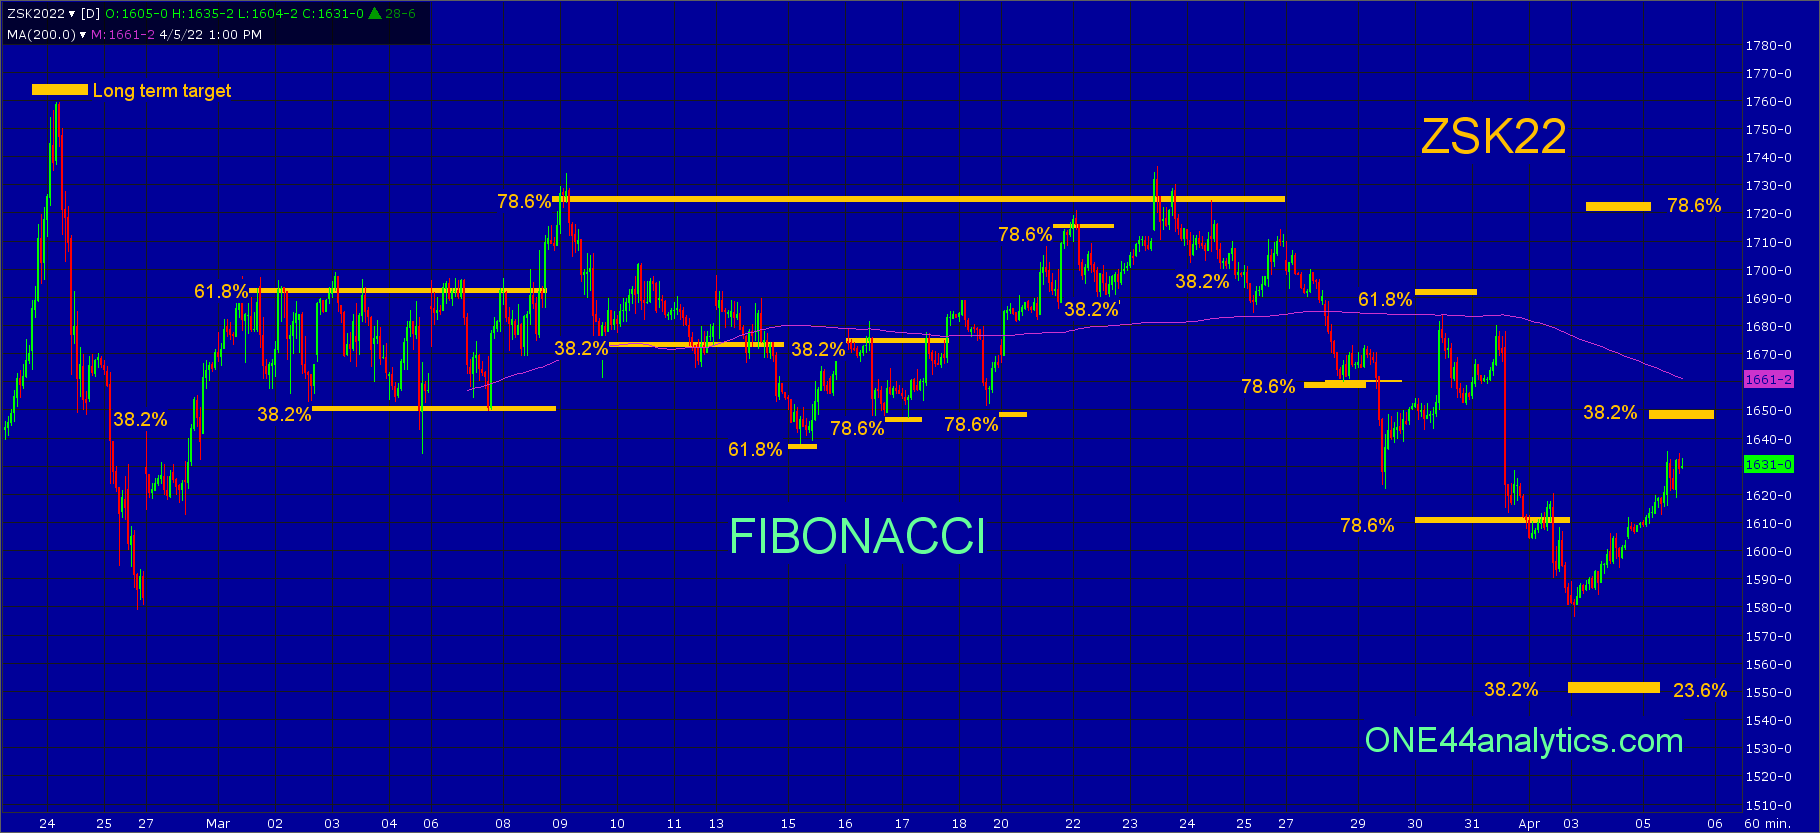
What highs and lows to use with Fibonacci retracements
When using the Fibonacci retracements, "Plan A" is you always want to be dealing with highs and lows that are the extreme for any move and "Plan B" is to be using the most direct high, or low and a lot of times it is a combination of both.
Using the May Beans as an example we will start with the combination of two key levels. The run up from the May 2020 low to the 6/7/21 high was a very direct move without ever getting back to 38.2% of the rally. It finally hit 38.2% on 11/9/21, this was the long term swing point based on the 38.2% rule,
38.2% is the single most important retracement and is the level we use for the "Golden Rule". This rule being, " any market that is going to keep it's current trend must hold 38.2%". As long as it does the trend will continue and it should make new highs/lows from that retracement.
The rally from the long term swing point took the market to the long term target of 1765.00, this rally also did not even retrace 38.2% back to the 11/9/21 low. This now setup Plan A & B. We now can retrace from the contract high to the contract low (the extremes) and then the most direct move up from the long term swing point. Using these two lows there is a combination of 23.6% back to the contract low and 38.2% back to the 11/9/21 low at 1552.00. When and if it hits this combination we would be looking for new highs for the move from it. A failure to hold this area should send it down to the long term swing point of 1405.00. The long term swing point (38.2%) will almost always be based on the extremes for the move.

The hourly chart brings up an issue when using the extremes of a move and the most direct one. Since the contract high of 1765.00 the lowest low was on 2/25/22 at 1579.00 and those were the extremes until Sunday nights low on April 3rd. I mention this because until it took out the 1579.00 low, we could only retrace back to the high on 3/23/22, this is also the most direct move. The issue is now that 38.2% back to the two highs are very close to each other, using the extreme it is 1646.00 and from the direct move down it is 1637.00, which do you go with?
The important thing to remember is that it is always the extreme of the two 38.2% levels that you use to determine if the trend is changing, however small that is. Can it turn from the first 38.2%, absolutely. The thing you want to avoid is getting in a trade at the first level without knowing of the second 38.2% and being stopped out at it and yet the trend is still down. Always start with the daily chart and the key levels and work your way down to the hourly to avoid missing any of the retracements.
If you are using daily ranges for the retracements, 1) make sure you are dealing with a large range for the day. 2) Be sure there is not a key high our low outside of that range that is more important to be retracing to, again it goes back to using extremes, no matter what scale you are using.