ONE44 Analytics 38.2% rule and examples
The golden rule is that any market that is going to continue it's trend must hold the 38.2% retracement.
Any failure to make that new high or low, or making only a slightly higher high, or lower low and getting right back into the range, sets up a run to 61.8% of that same move.
On another note, when they have reacted to 23.6% and fail to make that new high, or low it is rare that 38.2% is going to hold, it can, but less likely.
7/30/2020
E6U20
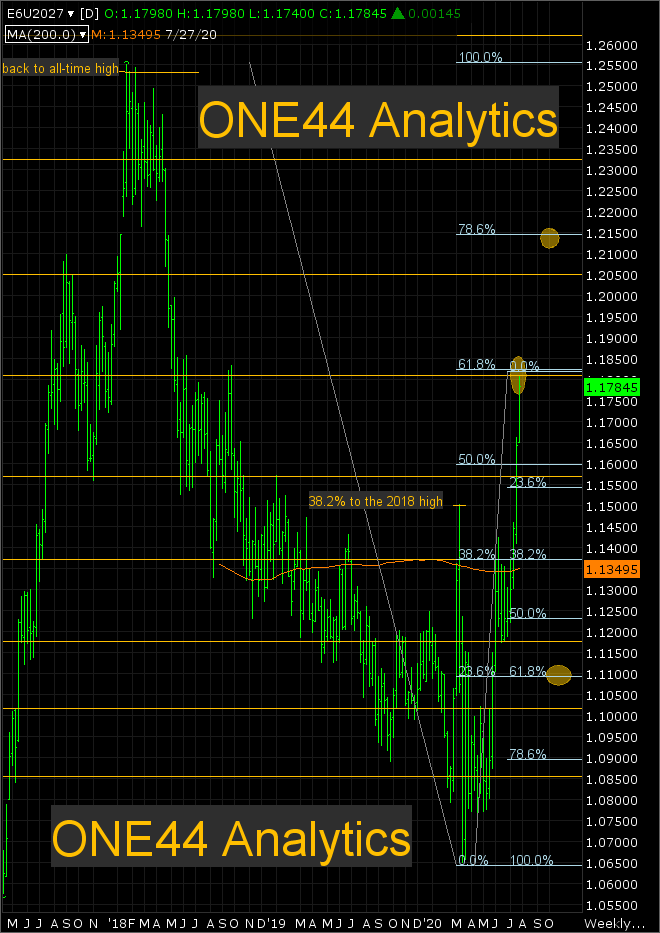
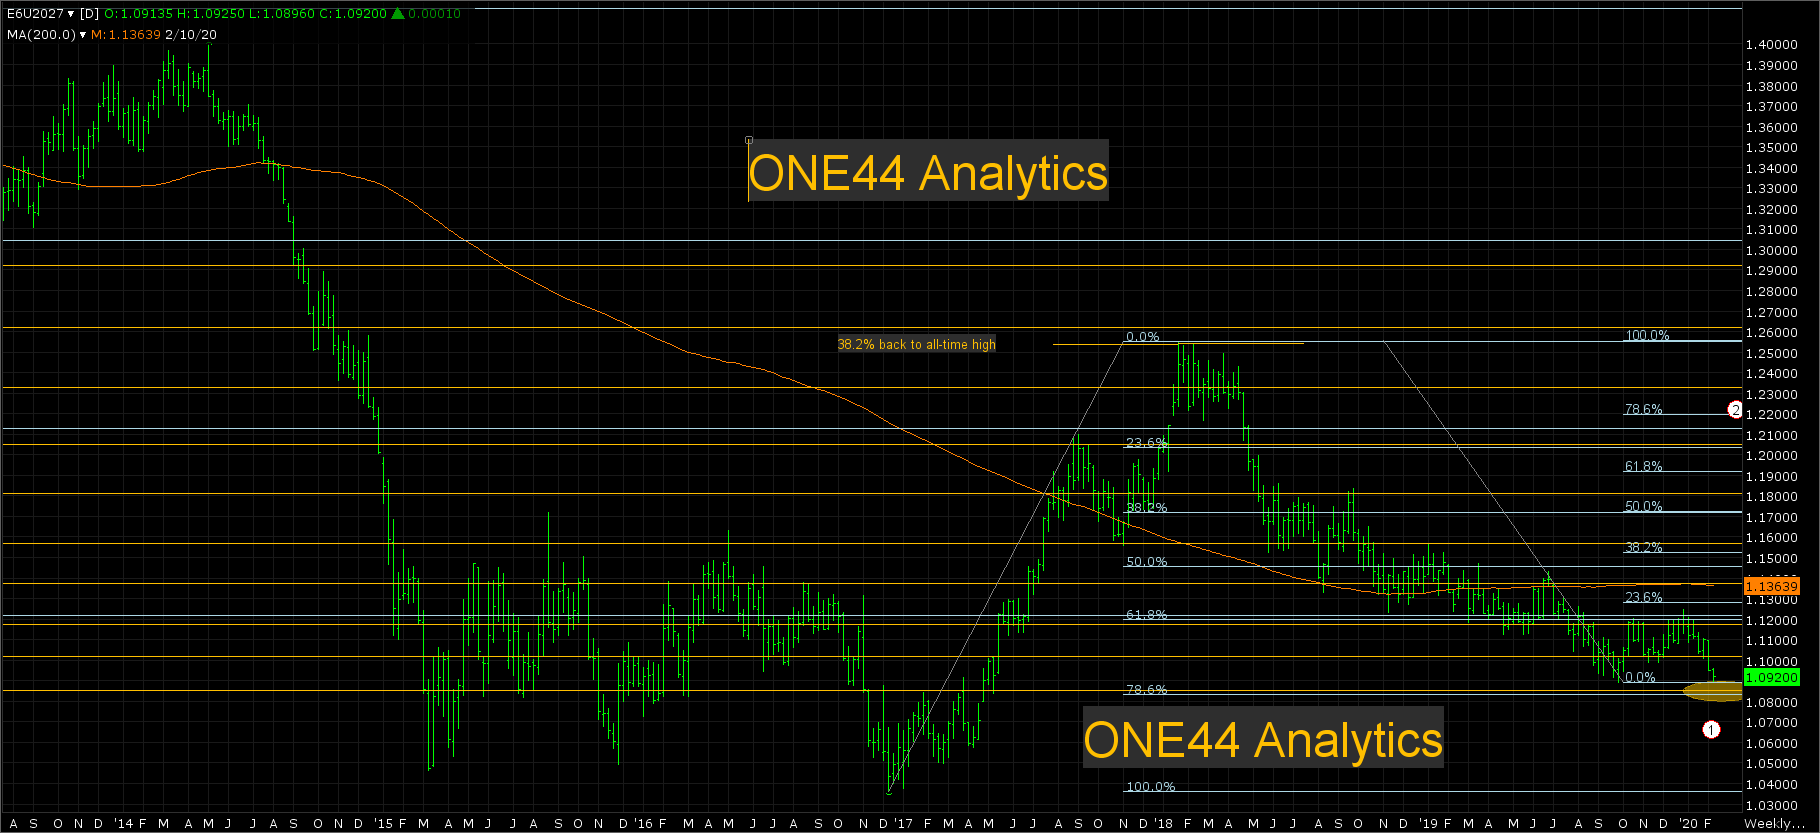
The target of 1.1815 has been achieved. This target level was determined once they had a couple closes above 38.2% of the 2018 high and 2020 low, this level was 1.1375. The 38.2% rule implies that once they have taken this level out, the next target becomes 61.8% and this was 1.1815. This is also a major Gann square, as marked on the chart below by the yellow horizontal lines. This is now the long term swing point. As for what to look for now we have to go to the 61.8% rule that is, "any market that holds 61.8% should go 61.8% of where it just came from", so this makes the long term target 1.1090. As always we will watch all the retracements on any break from 1.1815 to see just how weak, or strong the market is. The first target and most important area to watch on any break from 1.1815 is the major Gann square at 1.1370, this is also 38.2% of the current rally. Provided they can only get down to the major Gann square at 1.1575 and the 23.6% level at 1.1545, the market remains very positive. For the upside, a couple solid closes above the 61.8% level at 1.1815 and the next target is 78.6% back to the 2018 high, this is 1.2150. One other big area of resistance is the next major Gann square at 1.2050.
Feb. 11th 2020
Euro Currency update to Jan. 13th 2020 post
The post on 1/13/2020 exhibited what the Euro had done from the 2018 high and what to look for going forward.Now that the break from the 12/31/2019 high that was 38.2% (5) has taken them to test the lows again we are still looking for a new low based on the 38.2% rule.
As for what to look for now, we have to go out to the weekly chart,
Provided they make a new low, you can see that on the weekly chart below that 78.6% (1) of the December 2016 low and January 2018 high comes in at 1.0838. There would be two different things coming in to play here, first is, only making a slightly lower low after hitting 38.2% above tells us (per the 38.2% guidelines) to look for 61.8% back of that same move and that would be 1.1470. The second thing is that the target when you react from 78.6% is 78.6% of where they just came from and this is 1.2200 (2). This is extreme and could take years to complete, but it is the eventual target. You will always have to watch all the other retracements on any rally from this area to see just how weak or strong the market is. For now once a new low is made you can then use 1.0838 as the long term swing point, if this area is violated we will have to go out to the monthly chart for just how far it can go and if this happens another update will follow. On a rally from this area the first place to check this market will be 23.6% back to the 2018 high, this level currently is 1.1275 and this will change with a new low.
Jan. 27th 2020
Soybeans reacting to 38.2% update
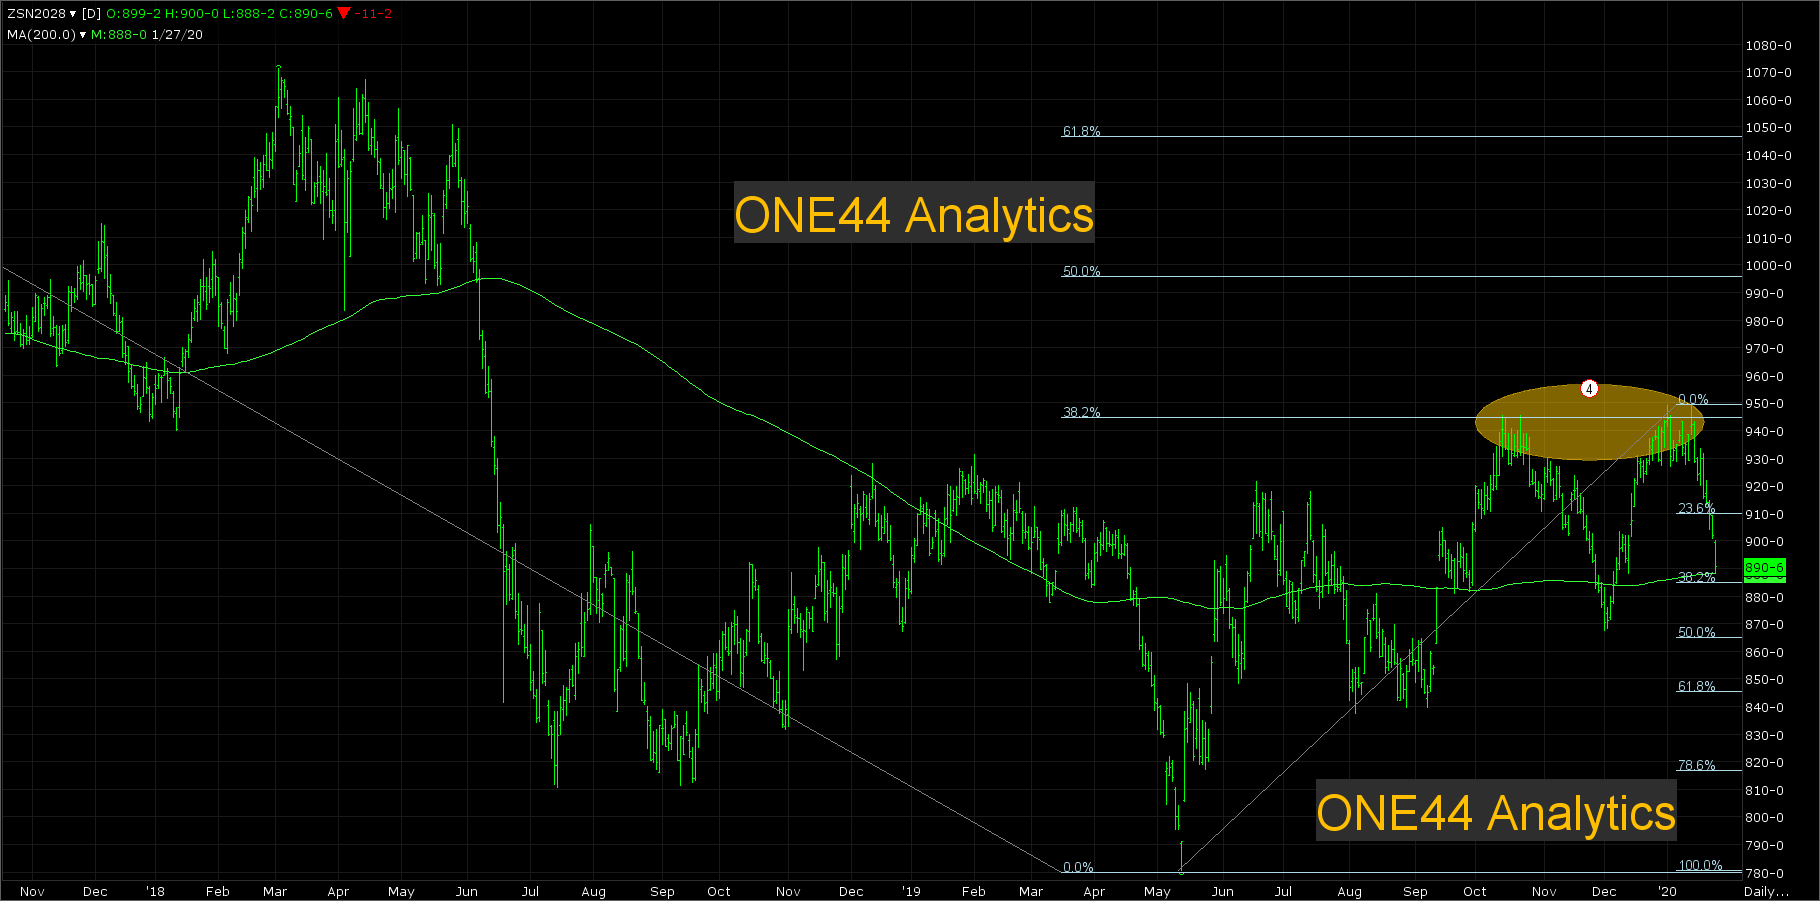
The current break is coming off of 38% (945.00) to the 6/10/2016 high, this is the second move away from this level and it is the long term swing point. The break from there should send it to new lows based on the 38.2% rule, but as always you have to watch all the retracements back down to see just how weak, or strong the market is. Right now they are just above 38.2% (885.00) of the rally from the 5/13/2019 low and to add more importance to this area the 200 day average is at 890.00. You can get long in this area and the risk is a solid close below 885.00, it can trade below it, but you want the close back above. Provided this area does hold and because they have already reacted from 38.2% (945.00) two times, the upside target will be 61.8% of the same move at 1045.00. Failing to hold 885.00 brings back the 38.2% rule target of new lows from the 945.00 level.
Jan. 25th 2020
Sometimes the levels can really be pushed, but the guidelines are still the same
PHM Example
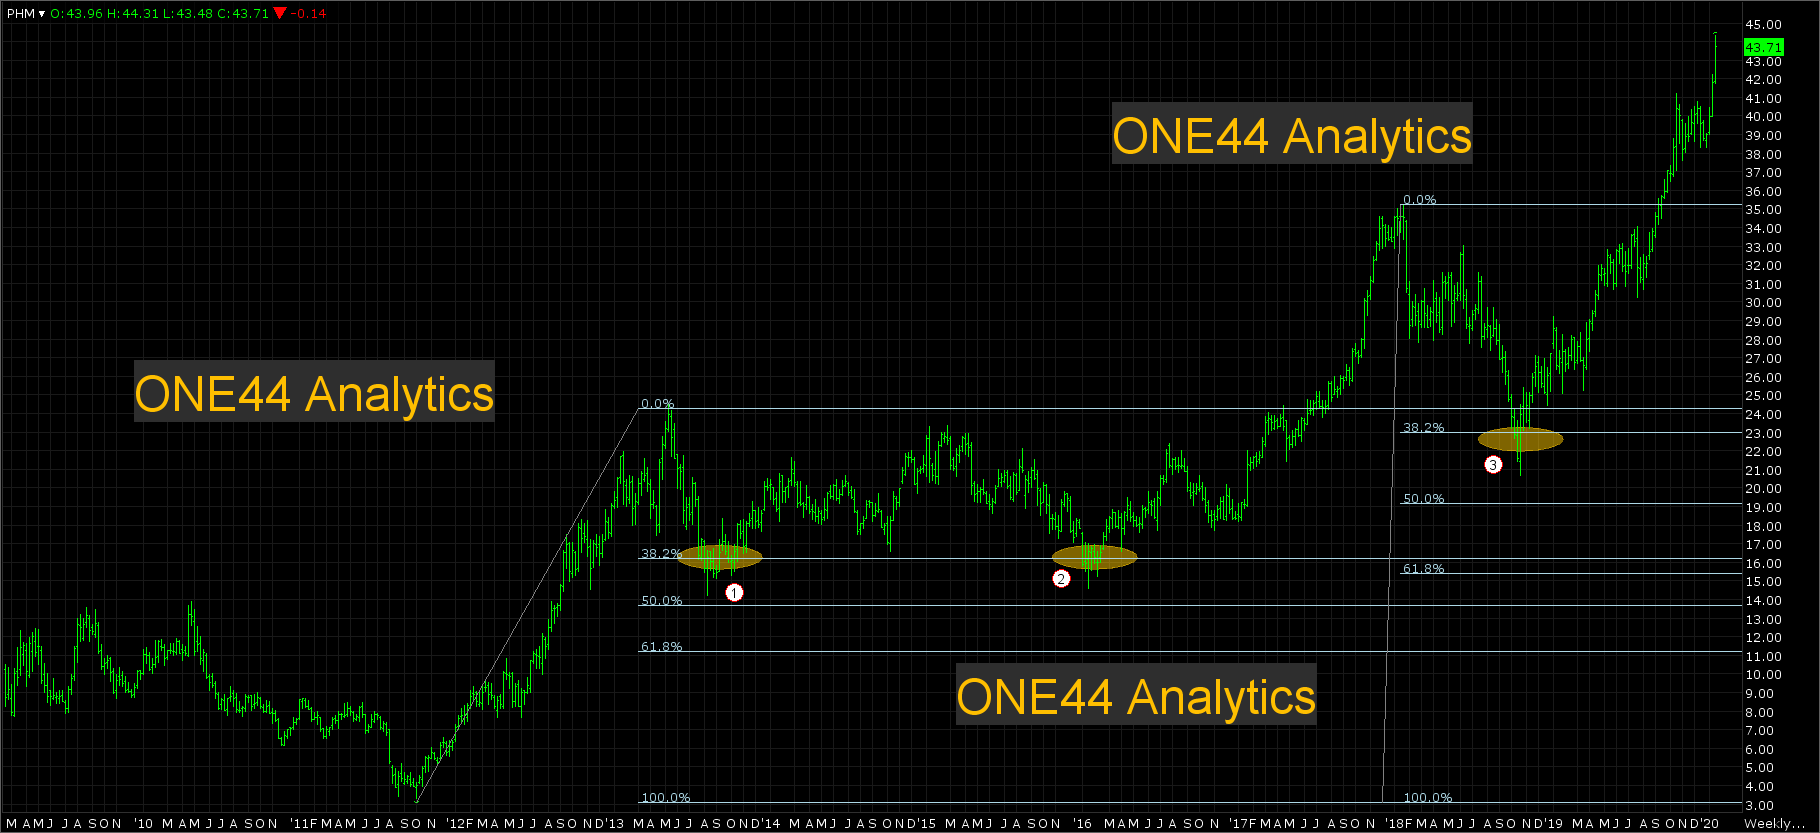
In this example we will show how the 38.2% levels were pushed through by more than the normal amount, but still had the 38.2% reaction. When you are dealing with long term retracements, always keep in mind where they are, even if you have been stopped out trying to be long/short. ( This is not something you should do in small ranges) The run up from the 2011 low to the May 2013 high gave us a 38.2% retracement at 16.10 (1). As you can see it went $2 past that price, usually we would then be looking for 61.8% of the same move, but they were unable to get there and then traded back and forth through 38.2% for 10 weeks, before attempting new highs. They did fail to make the new highs and again came back to 38.2% (2) in January 2016 where they traded for 5 weeks back and forth at that level before finally going for the new highs, which would be a normal reaction to 38.2%. The next major retracement came in October 2018, this was 38.2% (3) back to the 2011 low, Here too you can see it violated 38.2% by more than we would like to see, this time, having 2 weekly closes below it and once back above it they took off again to new highs that we would have been looking for from a 38.2% level.
Jan.23rd 2020
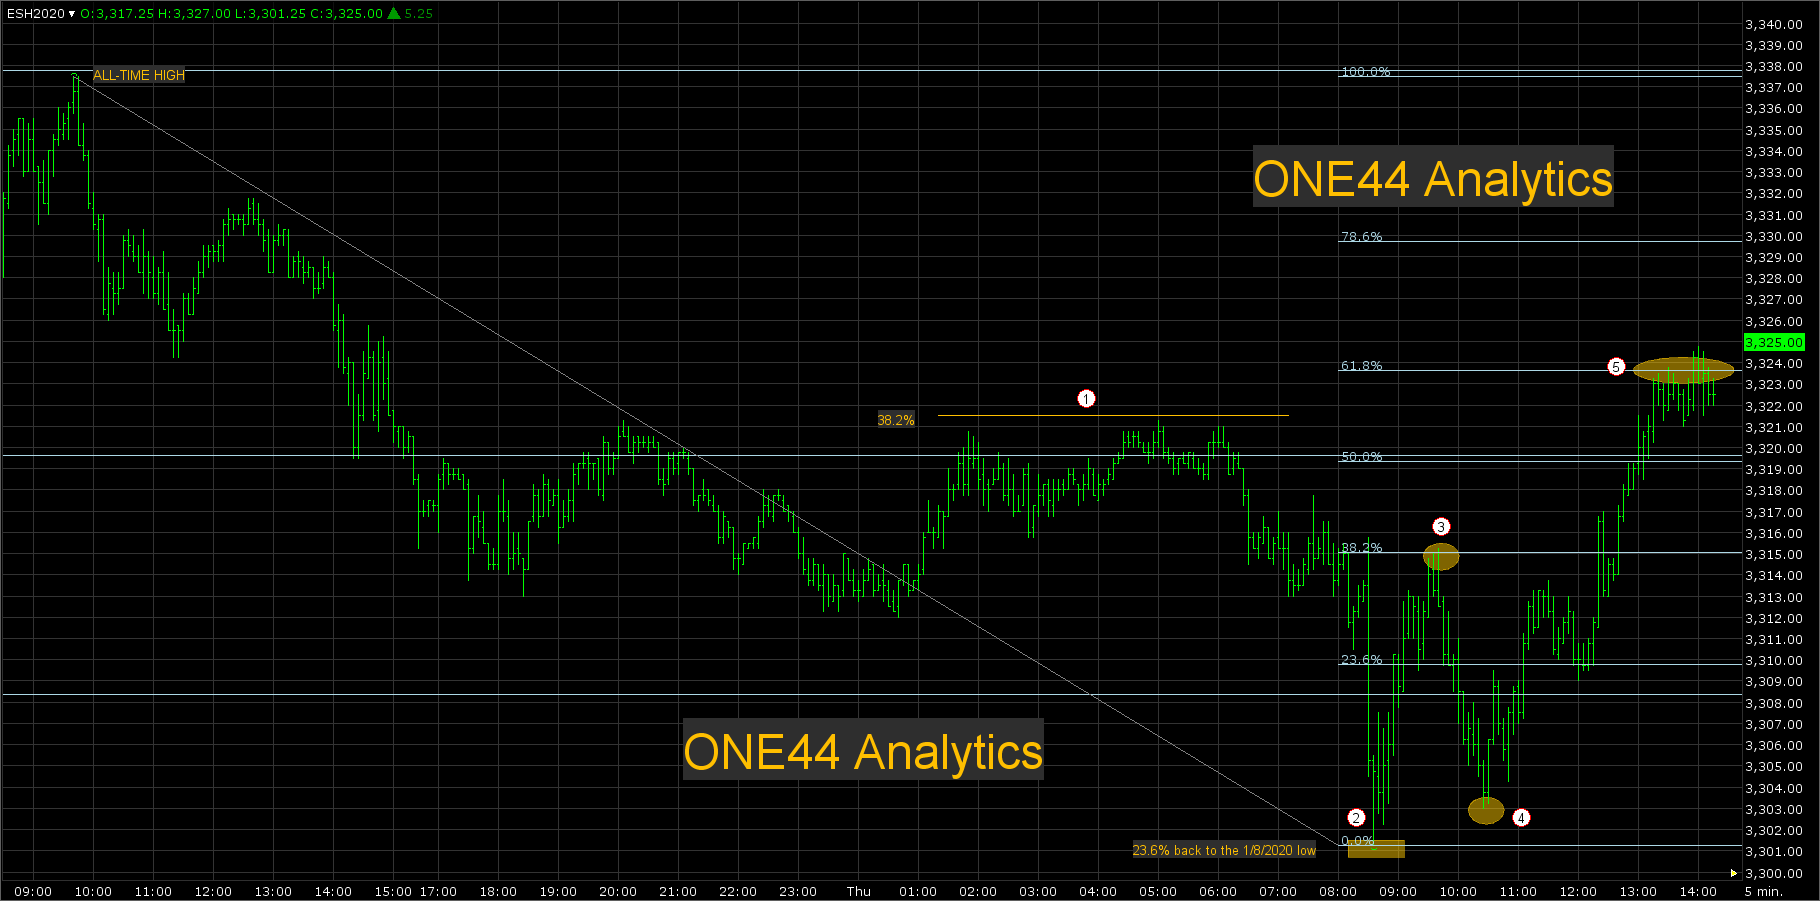
In this case we will use the 5 minute bar for the S&P, but the first chart will show you why the low was where it was today..
To be valid the rules have to work in all time frames, S&P
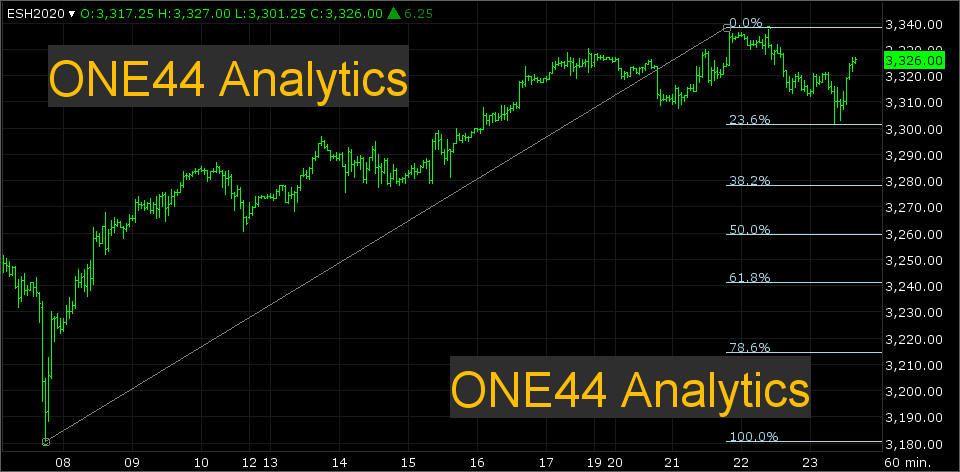
As you can see the low was 23.6% back to the spike low made on 1/8/2020 and this should take them to new highs. Now we will go over what happened after that. This next chart is a 5 minute bar for the last two days, the first being the new all-time high and then in to today. The overnight rally failed to even get back to 38.2% (1) telling us it should go for new lows, this was accomplished just after the opening on the 15 handle break that took it to 23.6% (2) back to the 1/8/2020 low. The rally from there went right to 38.2% (3) and the 38.2% rule implies it should go for new lows, it did break 12 handles from there, but it failed to make a new low (4) and if there is no new low, as the rule says, it should go 61.8% (5) of that same move and this happened at 1:30. This also fits nicely with the 23.6% (2) level that is calling for new highs.
Jan. 19th 2020
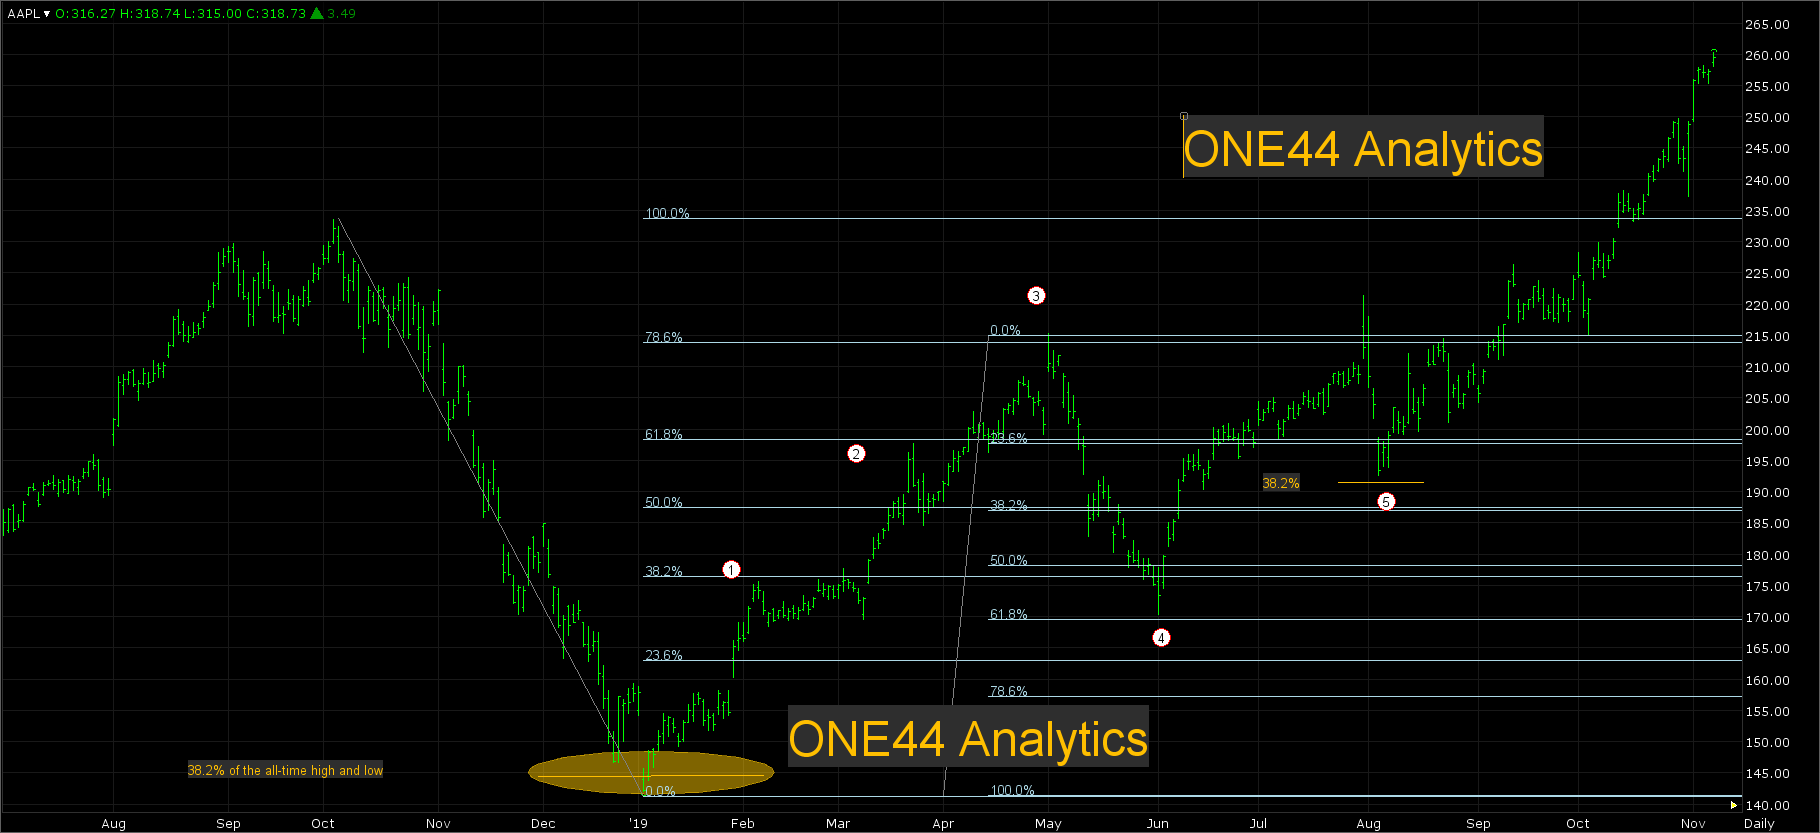
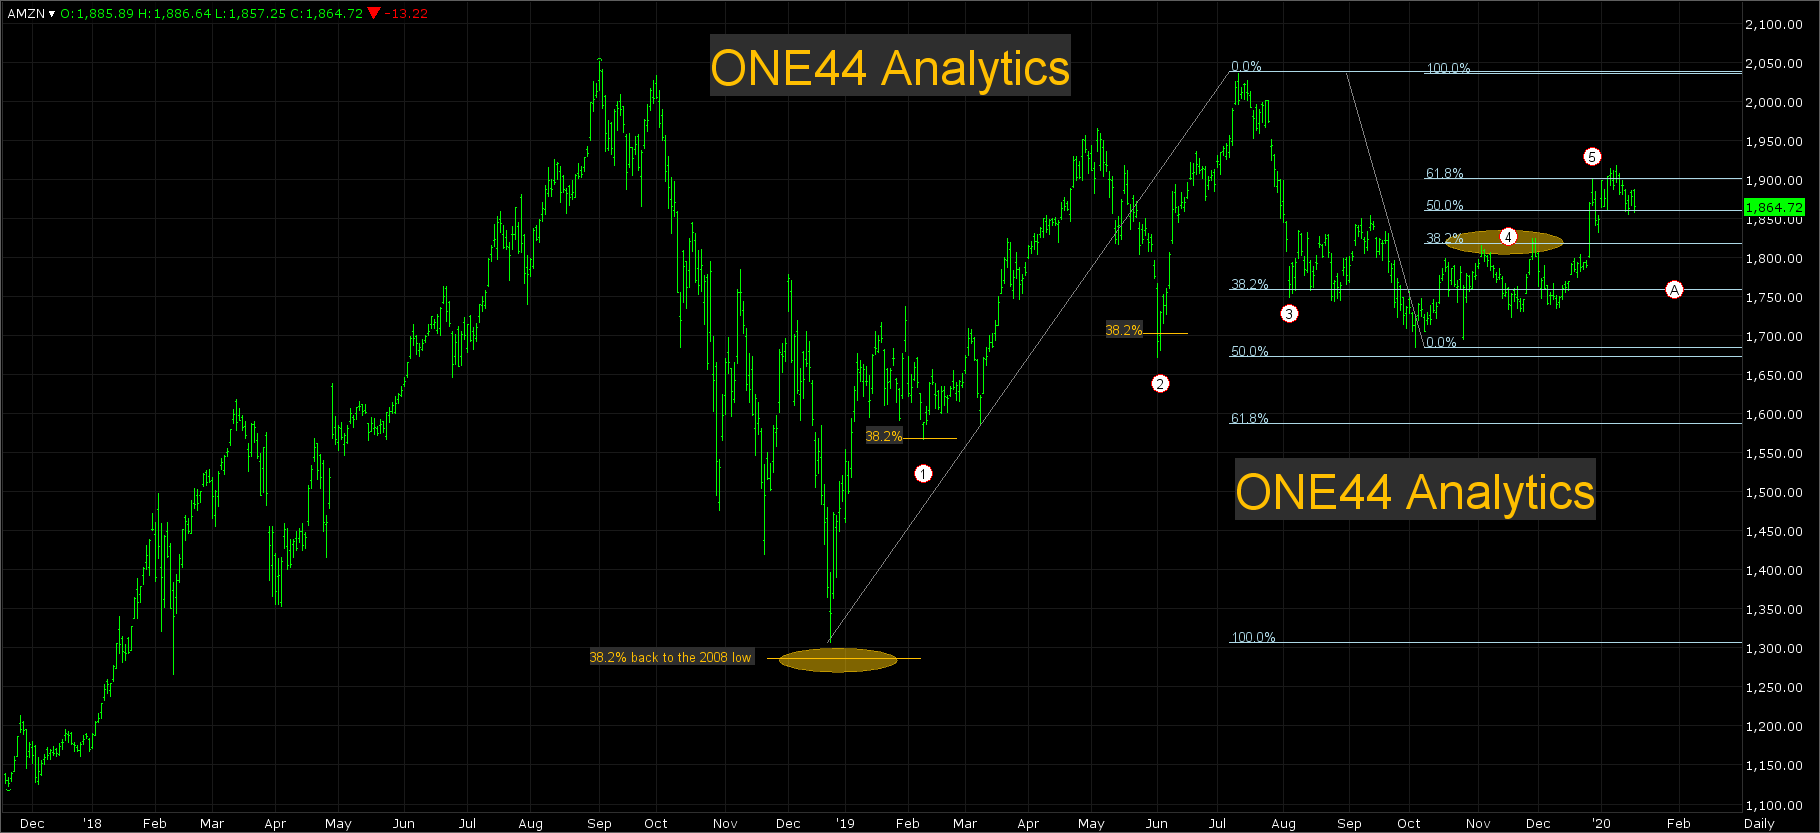
AAPL and AMZN hitting a major 38.2% level with different reactions, so far...
It can be very frustrating at times when markets hit major levels and then take months even years to complete the targets. At the end of 2018 AAPL didn't look to good, it just broke $90 from the 233.47 all-time high, but before you panic, you must go out to the weekly and even the monthly charts to see whats going on. The low for the move came right into 38.2% of the all-time high and low and turned around on a dime. We know that by holding 38.2% it should go for new highs, but you also have to watch the retracements back up to see how weak, or strong the market really is. On the following rally you can see that at 38.2% (1) and 61.8% (2) it had minor setbacks before 78.6% (3) sent it back to 61.8% (4). That break kept it well above 38.2% of the all-time high and low and the rally continued. The next setback (5) fell just short of 38.2% to the January low putting it back into a very positive mode and that lead to new all-time highs and a lot more.
In the second case of AMZN it also was not looking to hot at the end of 2018, but the break took it to just above 38.2% of the 2008 low and this also gave us a upside target in theory of new highs for the move. It started out very strong and the first setback hit 38.2% (1) of that leg and continued the rally, the next setback hit 38.2% (2) of the highest high since they hit 38.2% of the 2008 low, also keeping the market positive. The rally from there was able to make a new high for the current move, but failed to make a new all-time high, which is still the ultimate target. The break from that failure to make new highs took it to 38.2% (3) once again. It held above this level for almost 2 months before they started to chop back and forth though this level. Once they have taken out 38.2% you should look for 61.8% of the same move and also start to watch the retracements back to the high it is breaking from. The first couple highs back above 38.2% (3) hit 38.2% (4) back to the high and this is not a strong sign, but once they did clear it, they went to 61.8%. As for the short term the break from 61.8% should take them back to 61.8% the other way at 1775.00 (A). In the long term picture we are still looking for new all-time highs.
Jan. 18th 2020
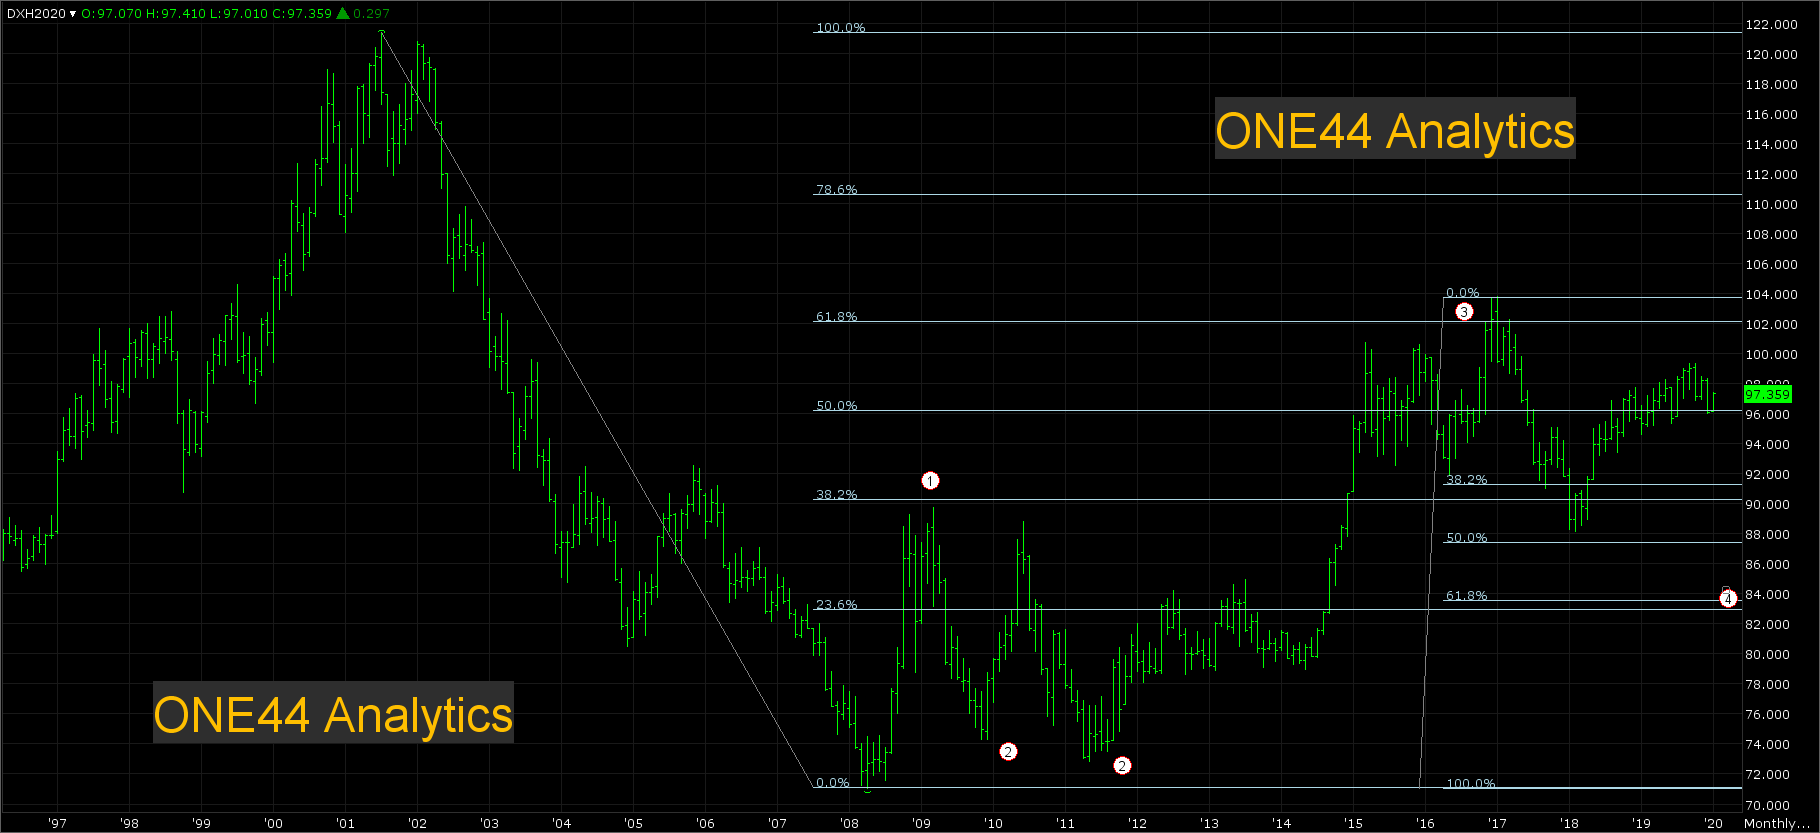
Sometimes it takes years for a market to complete a target.
When looking at the U.S. Dollar index over the last 20 years there has only been a few major retracements and targets. The first happened in 2009 when the market fell just short of 38.2% (1) back to the 2001 high, the 2 breaks from this area (2) failed to make a new low and this then gave us an upside target on a move higher of 61.8% (3) back of that same move. This target was achieved 6 years later in 2017 and because it is 61.8% the new target from there is 61.8% of the other way, this is 84.00 (4). This is a monthly chart and there were plenty of retracements on a daily chart, but it shows the importance of the long term view.
Jan. 17th 2020
The indications of a market turning from a bear to a bull, BONDS
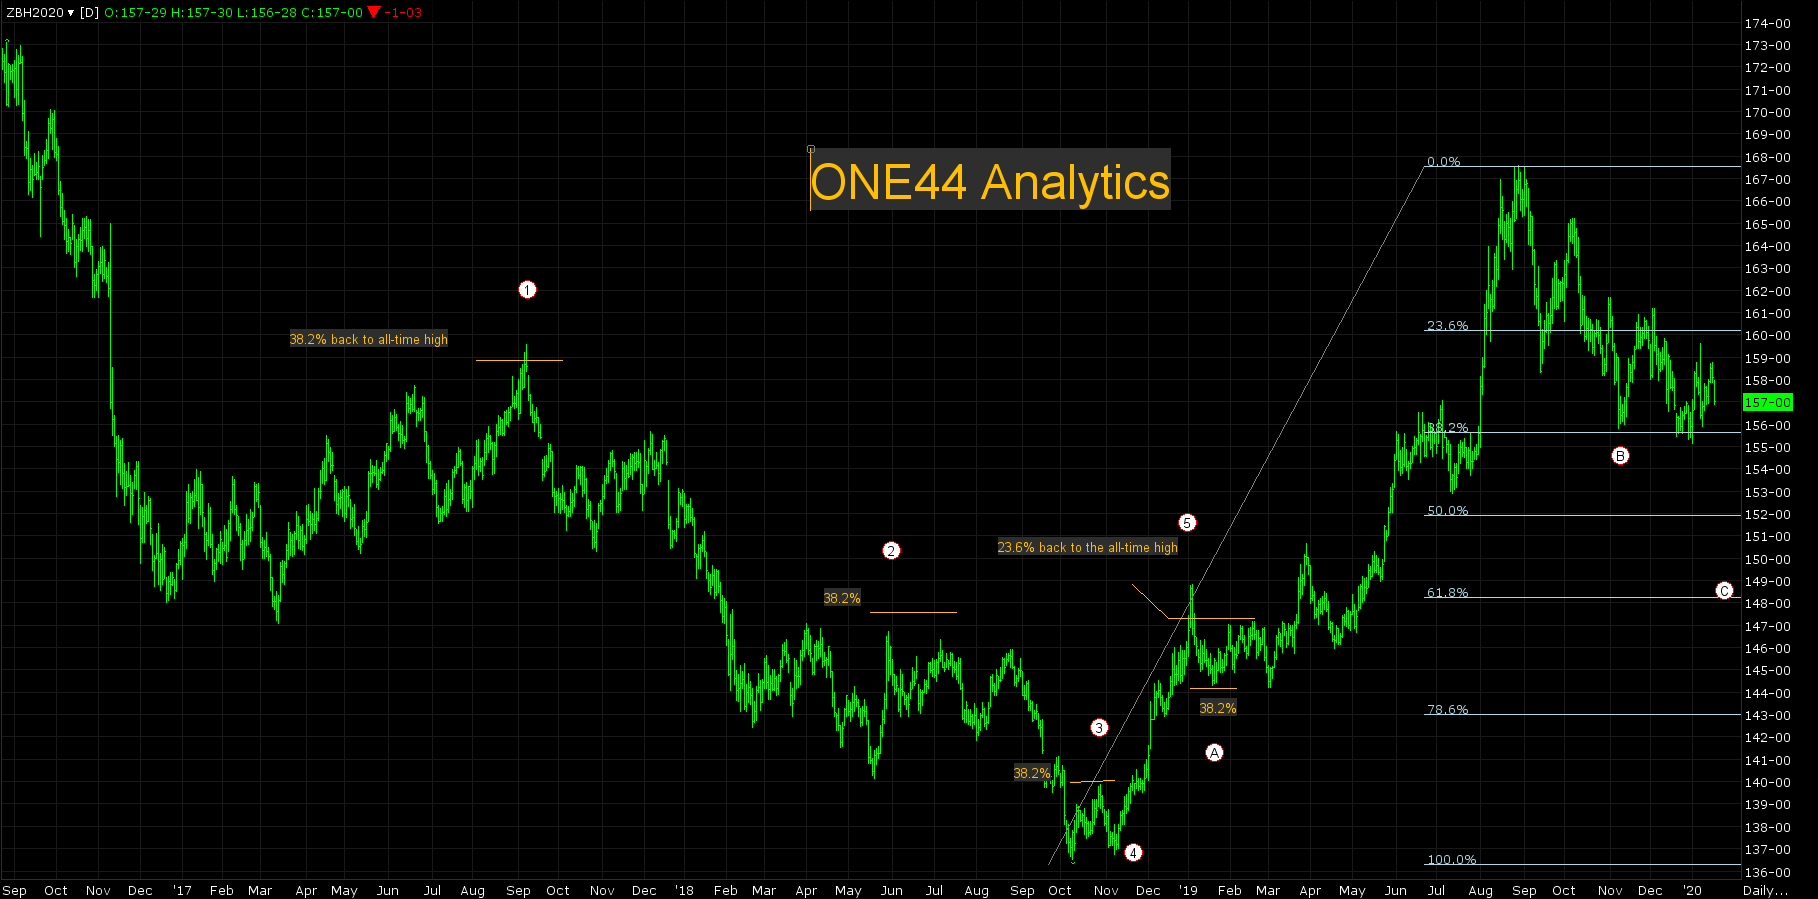
In this instance starting from the all-time high in Bonds we will show the indications of a market turning from a Bear to a Bull. The first 38.2% retracement that came over a year after the all-time high on 7/11/2016 (1) told us the Bear market is still intact. The break from there lead to even small attempts to rally, so we started to use the high on 9/8/2017 (1) to find tighter resistance. The rally from the lows could not even get back to 38.2% (2) of the 9/8/2017 high keeping this market very negative. New lows did follow and then we started to use the high on 5/30/2018 (2) to retrace back to. The high on 10/29/2018 (3) hit 38.2% back of that move, yet it failed to make a new low (4) giving us an indication the trend could be turning. Once they did clear the 38.2% level on 10/29/2018 they really started to take off. The market did spend 3 months trading sideways once they hit 23.6% (5) back to the all-time high, however the next indication that the market wanted to go higher was that the break from 23.6% of the all-time high could only go back 38.2% (A) of the move from the low. After clearing the 23.6% level back to the all-time high the market blew through 38.2% of the same move and there was not another attempt to go 38.2% back to the low until almost a year later and that brings us to where they are now. The break from the 8/28/2019 high has taken the market back to 38.2% (B) of the 10/9/2018 low. This is now the long term swing point, a rally from here should take them to new highs and a failure to hold it should send them to 61.8% of the same move (C).
Jan.16th 2020
Bitcoin failure to make a new high after holding 38.2%
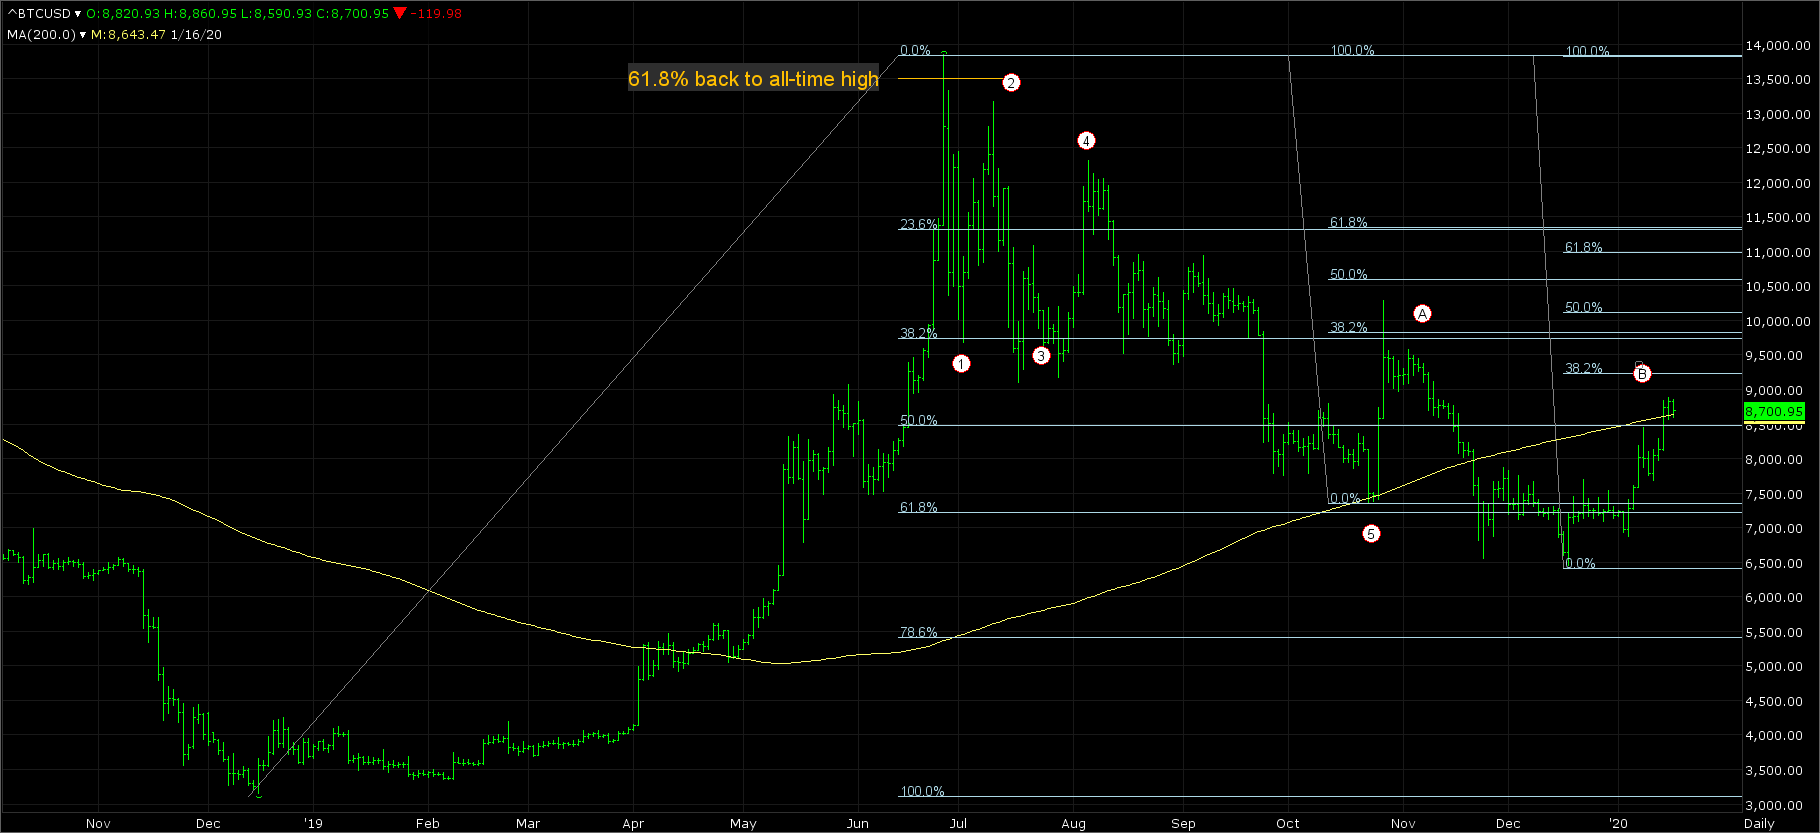
Under the 61.8% rule we already showed how Bitcoin hit 61.8% (13,500) back to the all-time and how it ended up going 61.8% the other way at 7200 to complete the target. In this review we will look at what happened in between those 2 levels. The break from 13,500 took it to 38.2% (1) of the December 2018 low. The rally from it failed to make a new high (2), this sets up a new downside target of 61.8% of that same move (7200). There was also another rally from the 38.2% area (3) before it failed again to make a new high (4) and that sent it very close to 61.8% (5), the rally from this area went 38.2% (A) back to the 6/26/2019 high, telling us that the market should go for a new low and that happened on 11/22/2019. With the current rally from the 61.8% area of 7200 the target is 61.8% back to the 6/26/2019 high, per the 61.8% rule, but if it can't get above 38.2% (B) of that same move, look for new lows again.
Jan. 13th 2020
Euro Currency Future 2018 to date
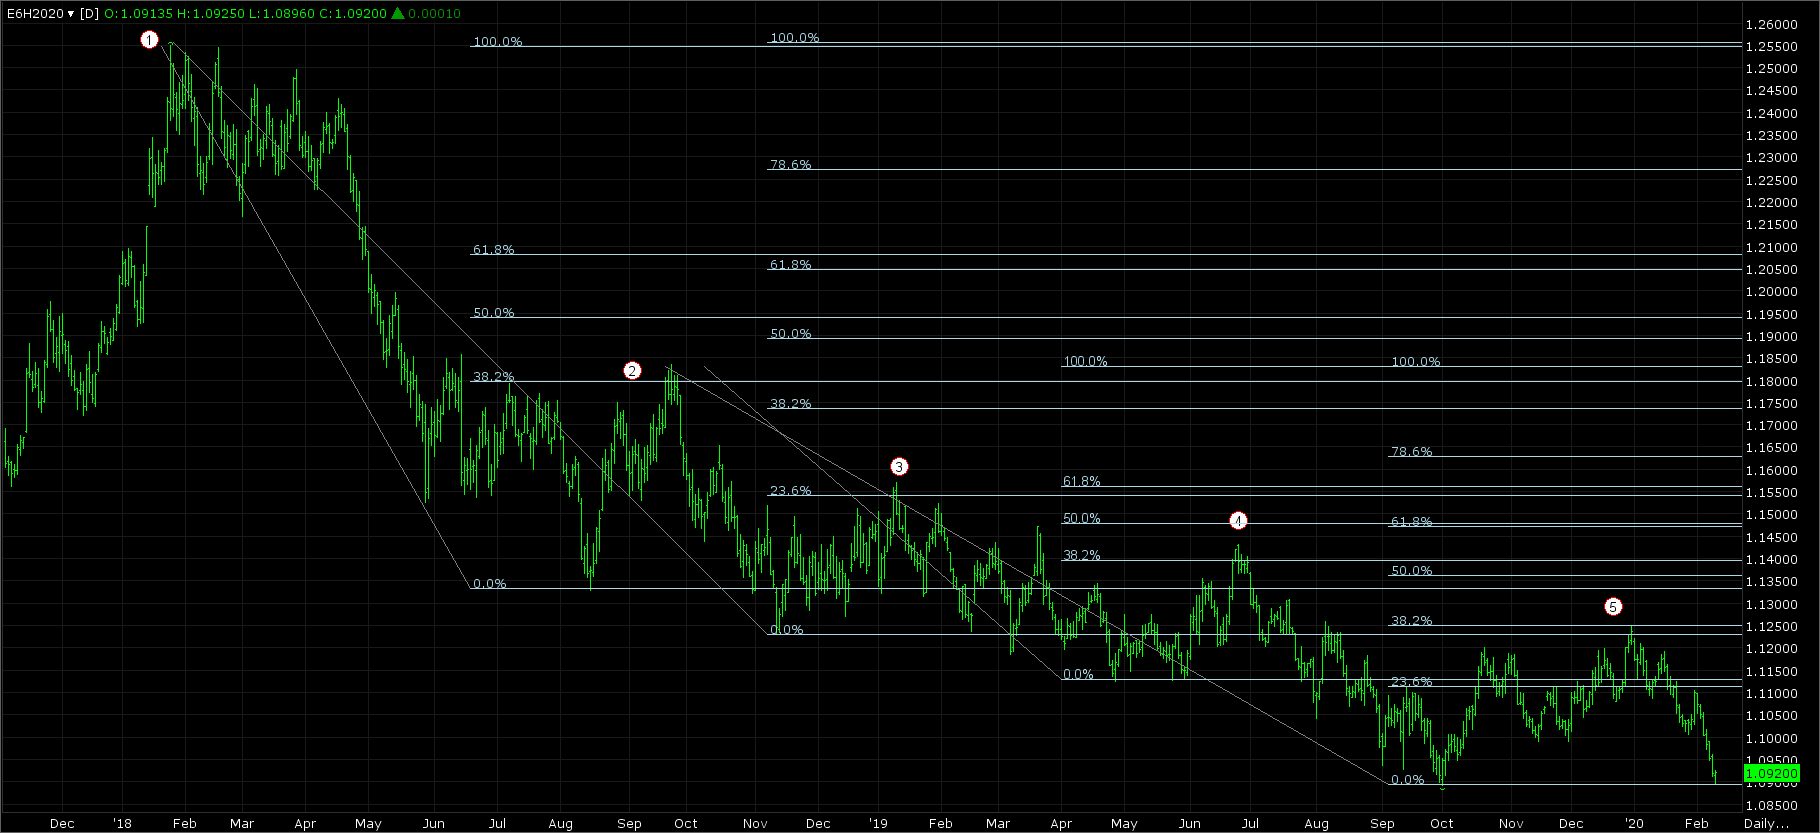
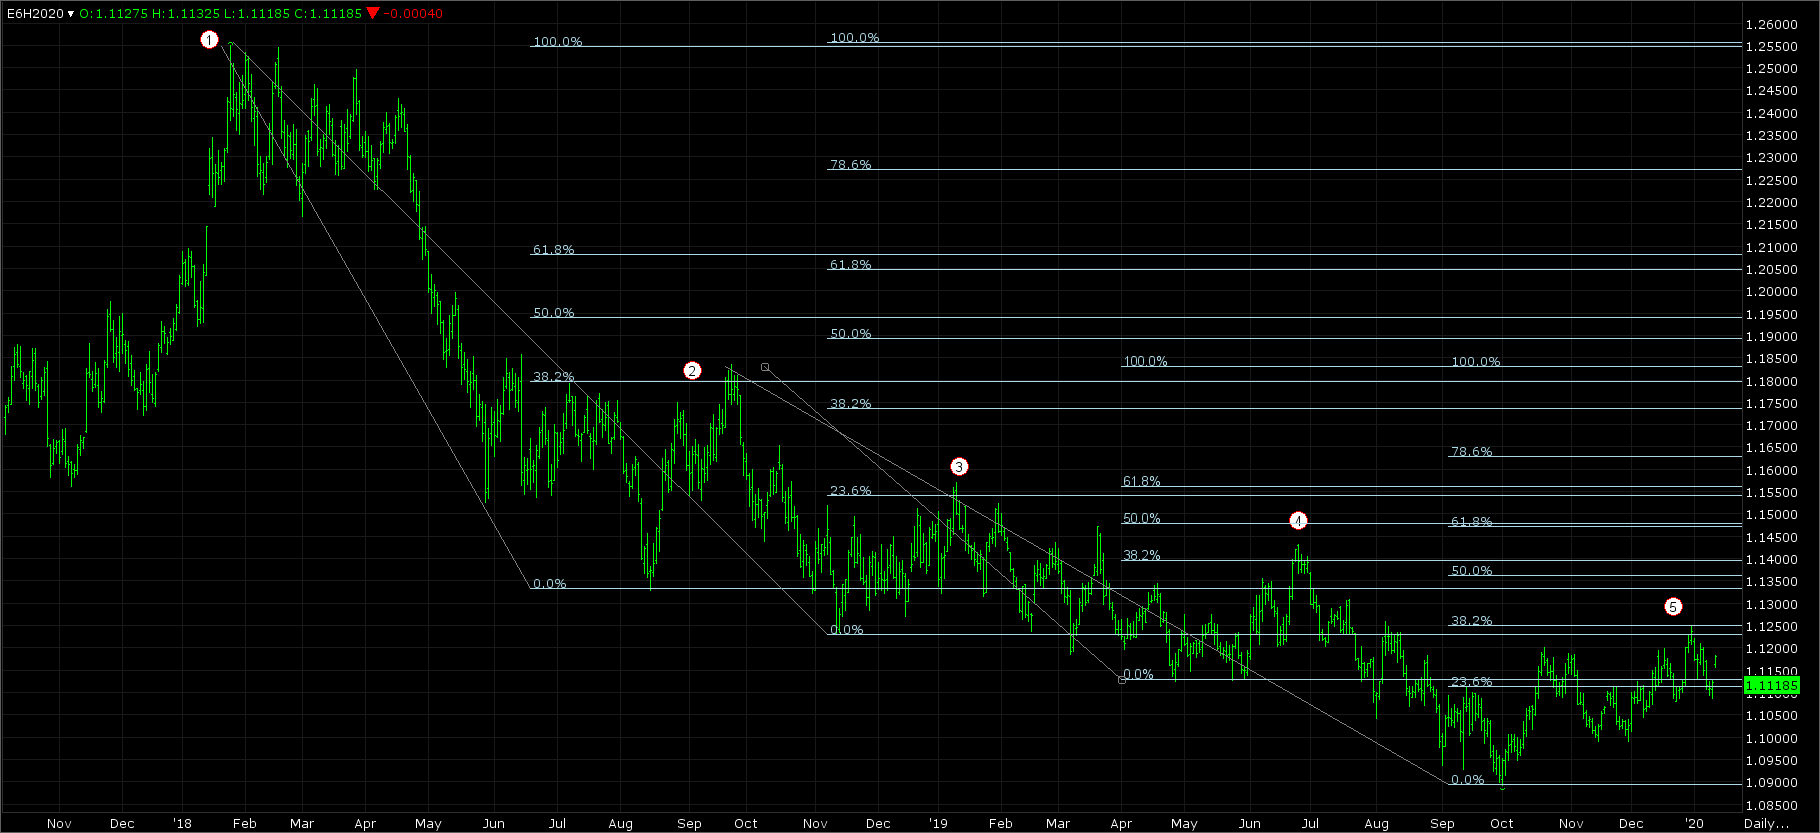
The bear market in the Euro that started in January of 2018 (1) was 38.2% back to the all-time high and this is where we start the analysis on this chart. The ideal target on a break from 38.2% is for it to go to new lows and along with that idea is that you have to watch the retracements back up to the 2018 high to see just how weak, or strong the market is. The first decent rally made a high in September 2018 (2) this was 38.2% back to the 2018 high. The next attempt to rally in January of 2019 (3) was stopped by 23.6% back to the 2018 high keeping this market very negative. The high in June 2019 could not even get back to 23.6% of the 2018 high, but did hit 38.2% (4) of high made in September 2018 (2). The last high made in December 2019 (5) hit 38.2% back to the September 2018 high as well. This is the key level to watch for the time being, a break from (5) should take them to new lows and with a couple solid closes above it, you can look for 38.2% back to the 2018 high.
Dow Jones Futures 2019 run
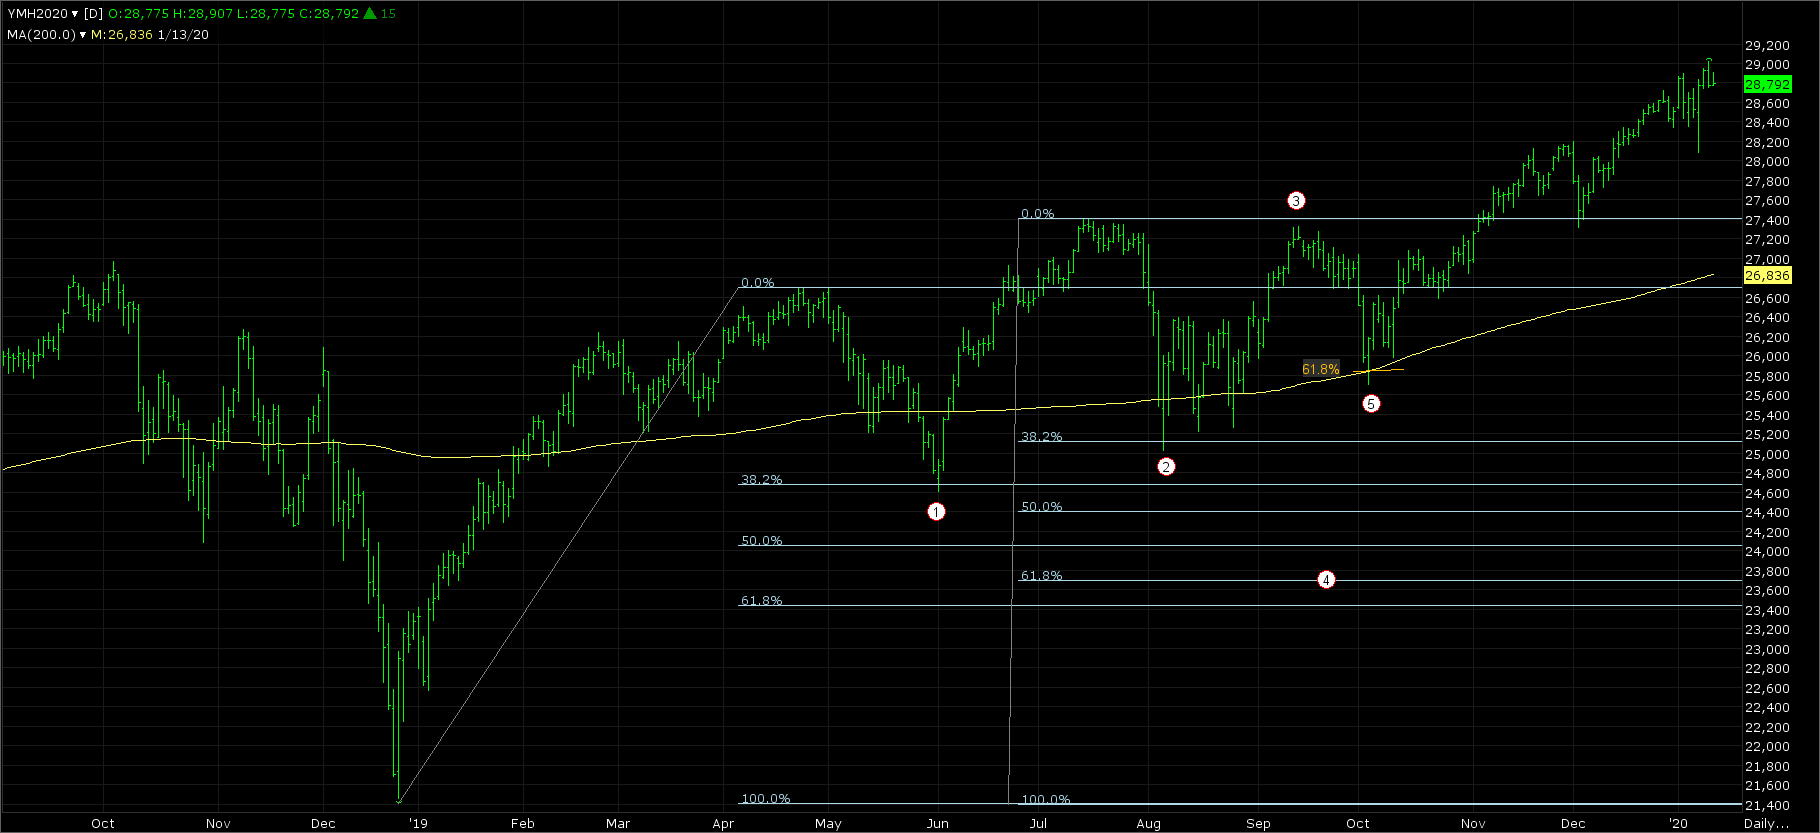
The 2019 run up in the Dow Futures had a couple good examples of the 38.2% rule. The first one was the low on 6/3/2019 (1) it hit 38.2% exactly and then went on to new highs which would be the first target. The second one on the 8/6/2019 low (2) also got right back down to 38.2%, but the rally failed to make a new high (3). The next target on a setback from this failure would normally be to look for 61.8% of the same move at 23,700 (4), however you always have to watch all the retracements on any move to see just how weak, or strong the market is. In this case the low on 10/3/2019 (5) hit 61.8% of the (3) high and the (2) low and the rally resumed going on to new all-time highs, this also fulfilled the (2) low target of new highs after holding 38.2%.
Jan. 8th 2020
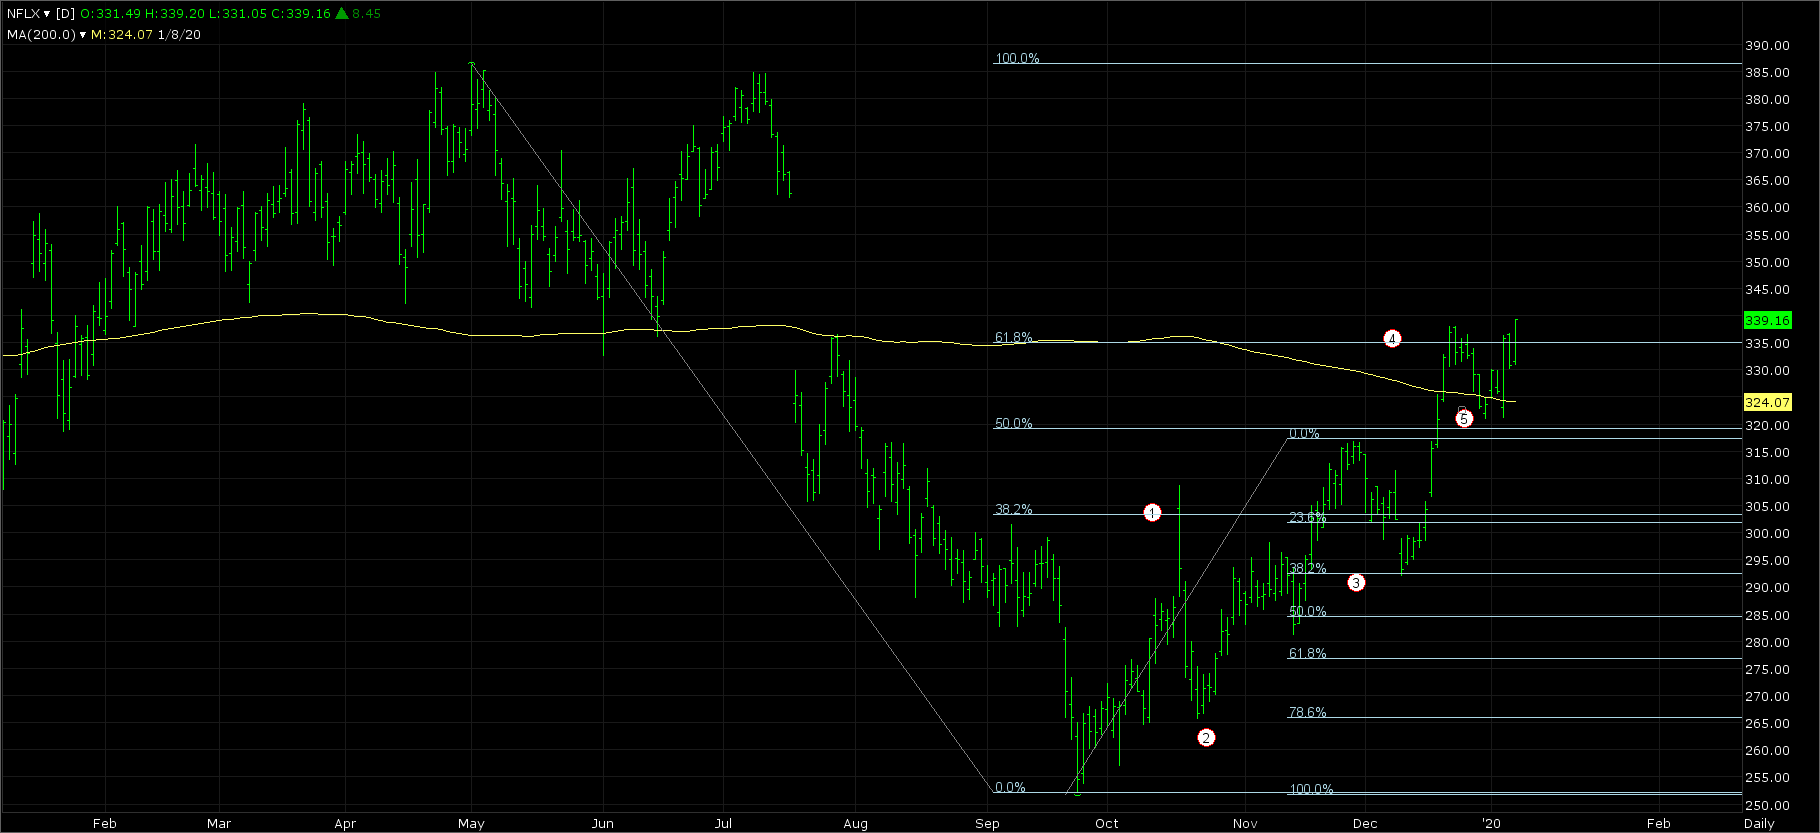
NFLX failing to make a new low after hitting 38.2%
The NFLX chart shows how when you hit 38% (1) and fail to make a new low (2) the long term target become 61.8% (4). When the market does turn and you are looking for 61.8% it should also hold 38% of the current rally, as it did at the 3 marker keeping the idea of 61.8% possible. After hitting 61.8% the target would be 61.8% the other way, per the rule, but you have to watch the retracements back down to see just how weak or strong the market is. In this case the break from there was only able to get 38% (5) to the (3) low keeping the market very strong. They still could get a break from this area and if so you know 61.8% would be the target and with a couple solid closes above 61.8% (4) the target becomes 78.6% of the same move.
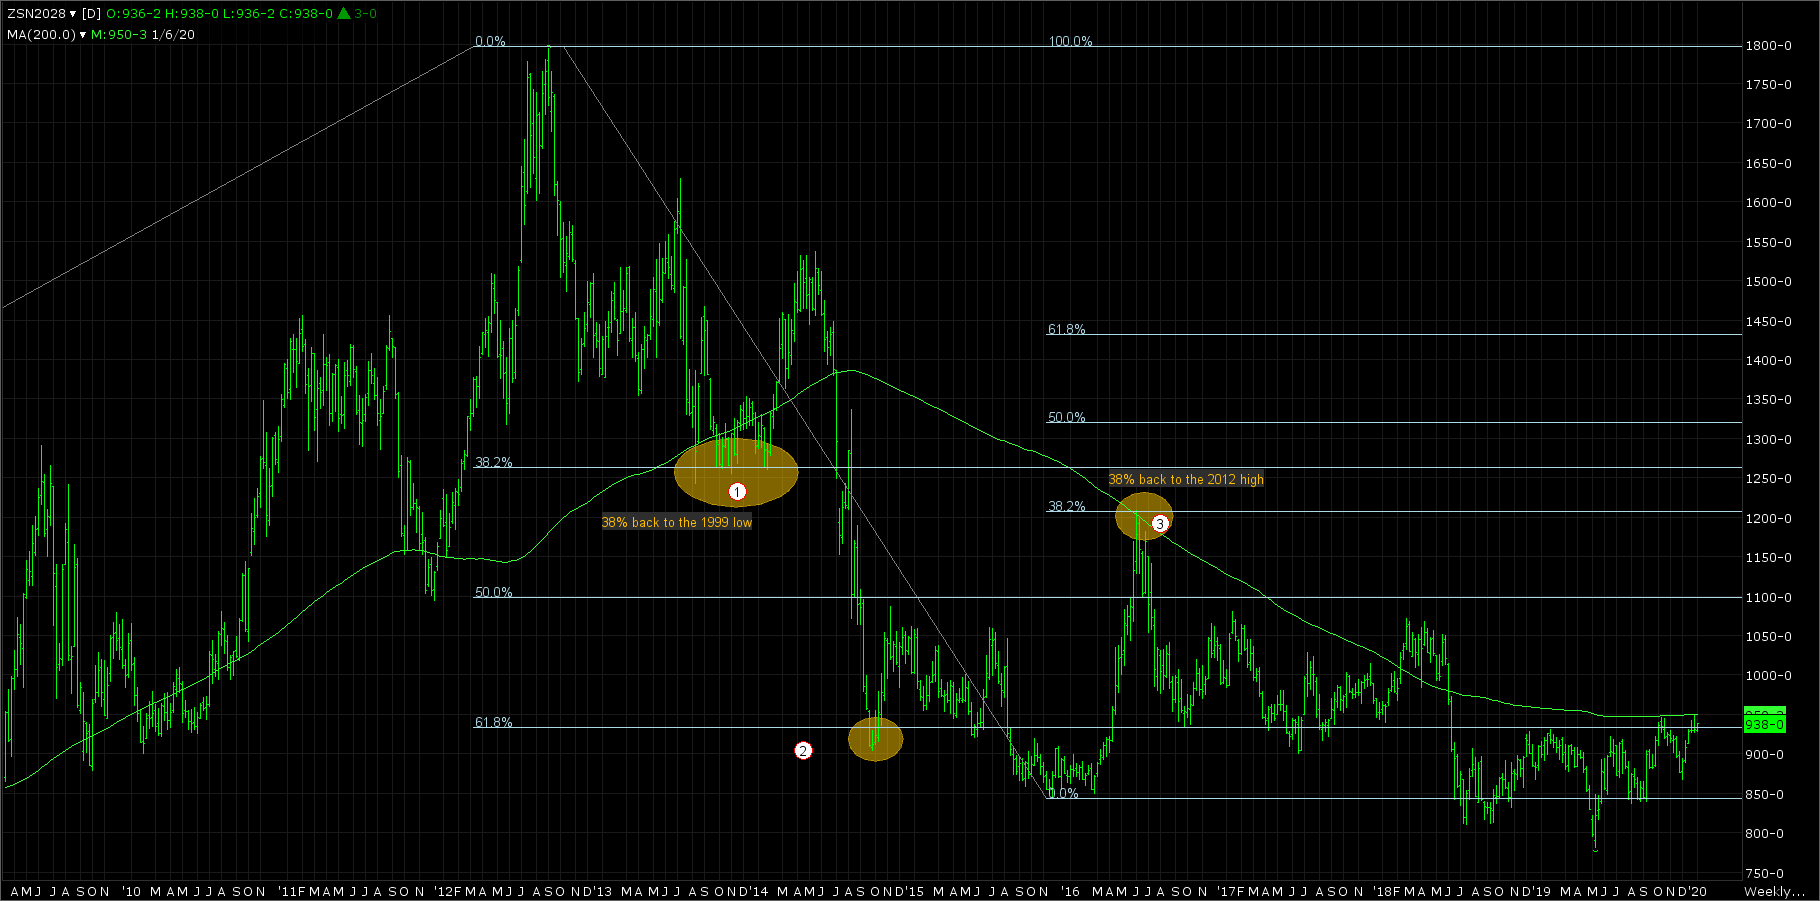
38.2% new highs, no new highs, Soybeans
The weekly Soybean chart below gives two examples of the 38% rule. The first one (1) failed to make a new high after hitting 38% which then gave us a downside target of 61.8% back (2). The second example (3) hit 38% back to the 2012 high and as the rule implies it should go for new lows and it did.
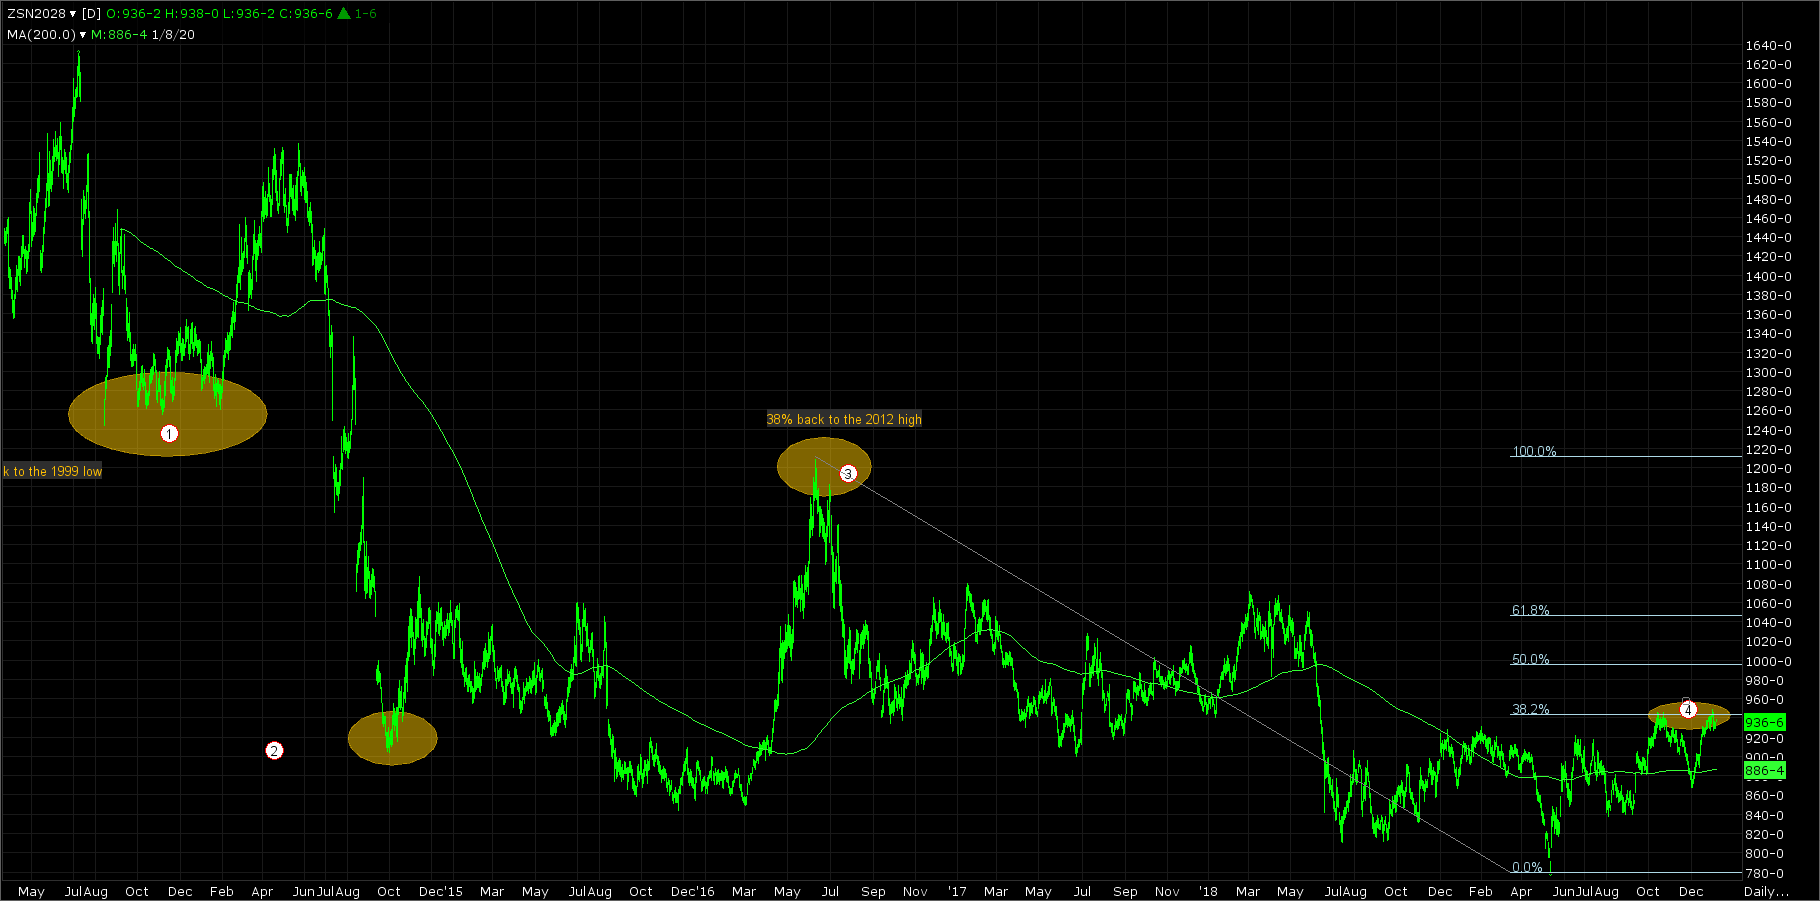
To bring this up to date the second chart shows the market at 38% (4) back to the 2016 high after making new lows from there. They broke over 70 cents from 945.00 in October and did not make a new low for the move and are now back at the that level. Once they can get a couple solid closes above 38% (945.00) the target becomes 61.8% at 1045.00. On a bigger move higher we would use the retracements back to the all-time high for targets. On a failure to get above 38% the downside target is still new lows.