ONE44 Analytics 61.8% rule and examples

*Any market that hits 61.8% of a move should take it back to 61.8% of where it just came from.
Jan. 25th 2020
Breaking out of a 61.8% trade zone and going into a major bull run, DNKN
Going back to 2016 in DNKN you can see that the low was 61.8% (A) back to the all-time low, this led to, as the rule above implies, "the market should go 61.8% (B) back to where it just came from" and this happened in April 2015. This lead to another 61.8% (C) retracement in June 2016. From there it started a major bull run and each of the bigger setbacks went right to 38.2% and then on to new highs. The first was in August of 2017 (1) at 50.90, the second one was in February of 2018 (2) at 56.80 and the third on came in December 2018 (3) at 61.80. As of this post the bull market continues on a very positive track with the biggest setback in 2019 holding 23.6% (4) of the 2016 low. The rally from this area should go on to new all-times and any failure to do so would give the first sign of a trend change. Keep in mind that a lot of the failures to make a new high end up hitting 78.6% before turning and as mentioned in other posts, that since the market has held 23.6% (4) for over four months there is a higher probability that 38.2% will not hold once 23.6% taken out without making a new high. With a new high all the levels get reset.

Jan. 24th 2020
A trend change that leads to a 61.8% trading range, DAX
The break from the 1/22/2018 high in the DAX futures index went right to 38.2% (1) of the 2/8/2016 low. This should have led to new highs for the move, they failed up at the 78.6% level and we know that not making a new high from a 38.2% retracement should send them to 61.8% of the same move. This target was achieved on 12/10/2018 (3). *On a special note about any major retracements, they will sometime go through them and then get back above/below, when this happens the rules and targets are still be the same as if it held perfectly. This plays out in the next two levels hit, the low exceeded 61.8% (3), but quickly got back above it and the target became 61.8% the other way, this was reached on 4/22/2019 (4) they spent the next 15 weeks chopping back and forth through 61.8% before hitting 61.8% the other way on 8/12/2019.

Jan. 20th 2020
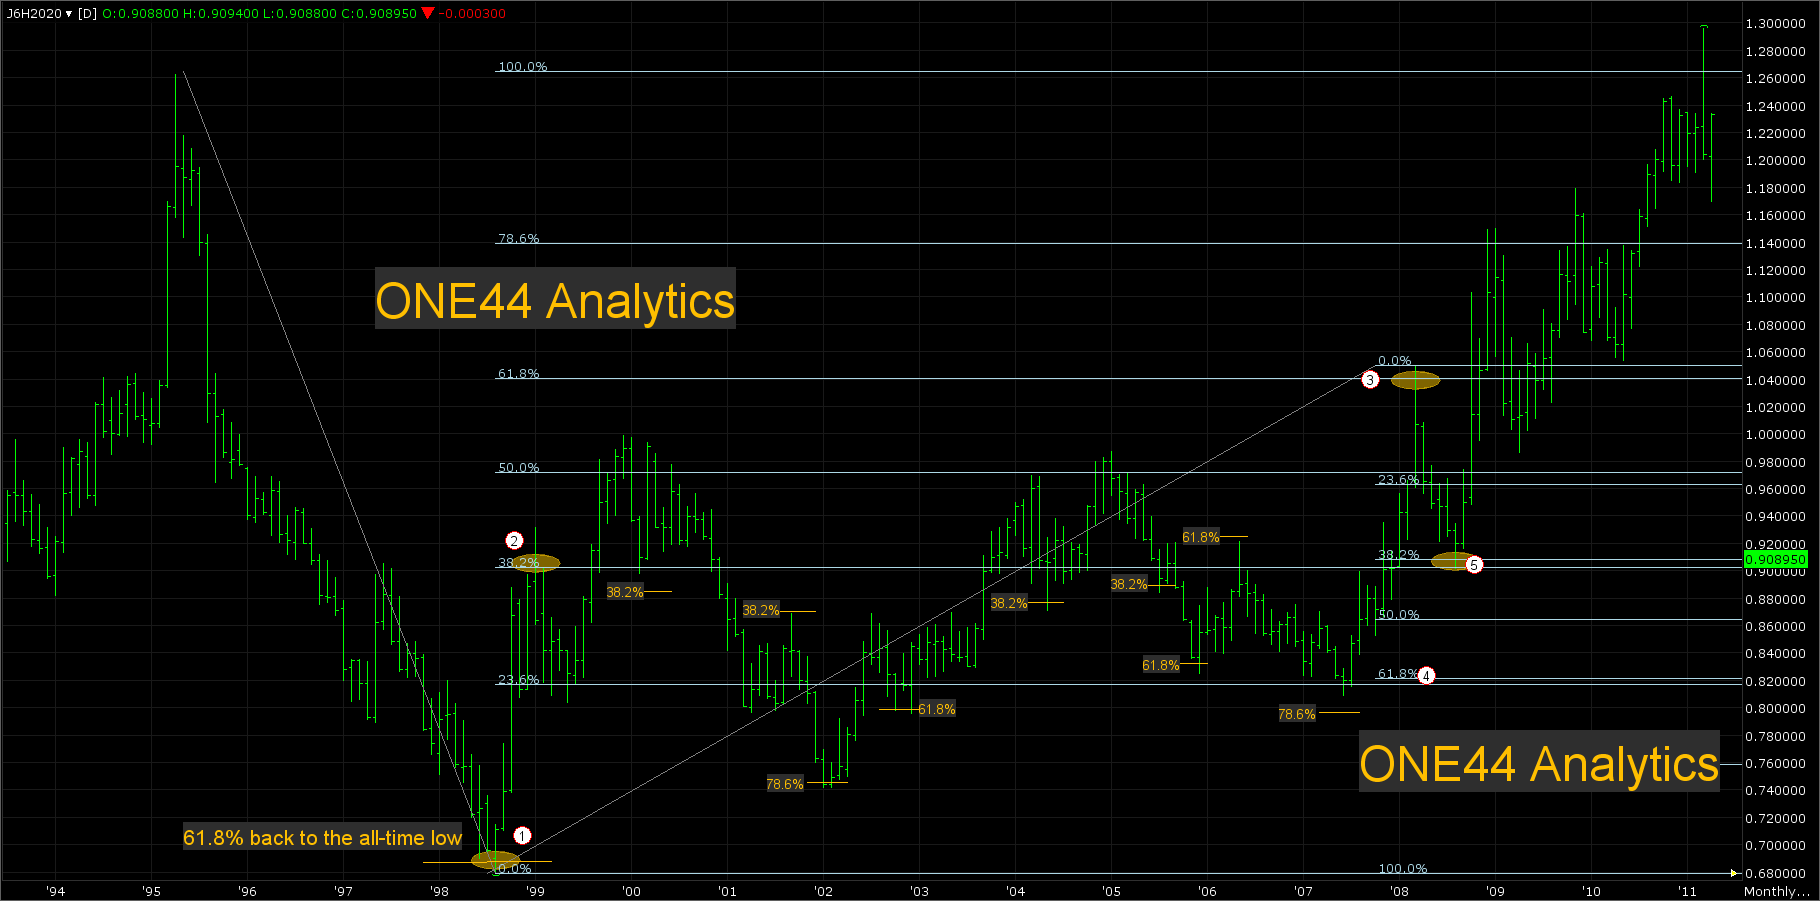
Reacting from 61.8% can cause a large trading range, Yen
When the market holds 23.6%, or 38.2% it tells us the current trend is going to continue and to look for new highs/lows. With the 61.8% rule we know it should go 61.8% back the other way and this can take a lot longer to achieve in some cases and keep it in a large trading range. In this Japanese Yen example we start from the 1998 low that was 61.8% (1) back to the all-time low, the target should be 61.8% back of where it came from and this was 1.0400 (3) that was hit a decade later. The first rally from 61.8% (1) went up to 38.2% (2) and reacted, but didn't make a new low and the failure to do so told us that a trend change is possible and if so, the next target would be 61.8% (3). After hitting this target a break from this area should give us a target of 61.8% the other way and that would have been .8200 (4). The guidelines also tell us that no matter what the target is you still have to watch the retracements on the current move and the break from 61.8% (3) held 38.2% (5) back to the 1998 low (1) telling us to look for new highs. This did happen and it got them out a major trading range and onto a new bull market. In between the two 61.8% levels were a few major advances and declines lasting 2 to 3 years each. On the chart you can see the retracements that they hit in each of these runs and those will be examined in other posts.
Jan. 19th 2020
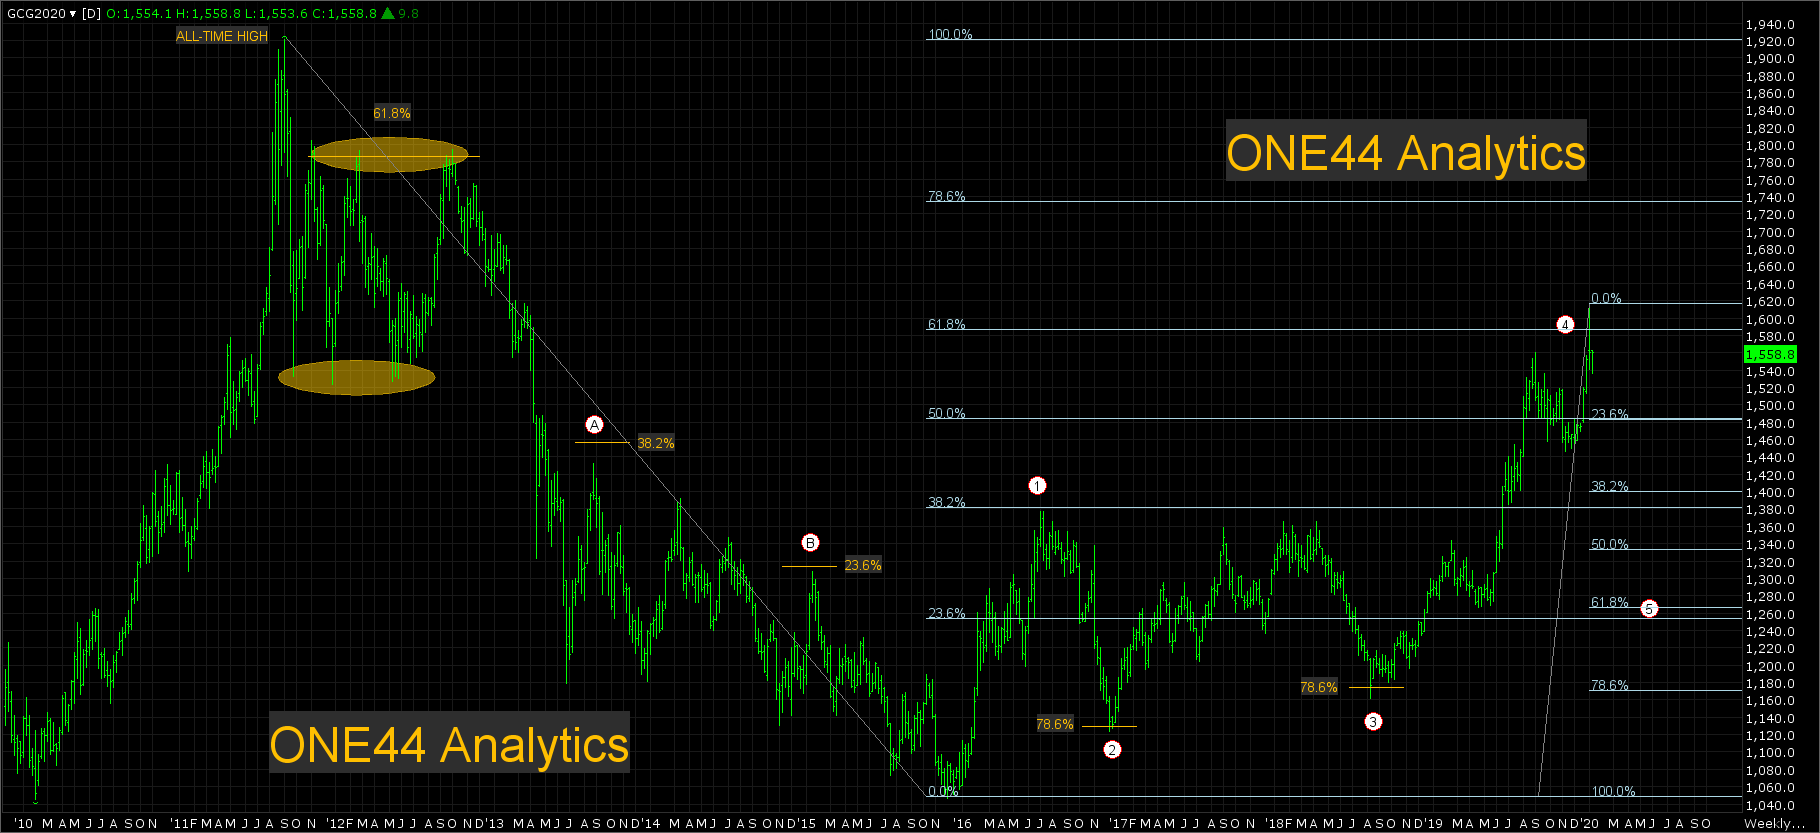
A change in trend leading to a 61.8% target, Gold
In a post in the 23.6% rule section we saw how Gold gave the indication that the trend was turning after the all-time high and how it was unable to get above 61.8% of the range. In order to keep as few lines as possible on the chart for better viewing I have marked the key retracements on the break from the all-time high. The first sizable rally after the trend change came at 1432.90, this fell short of 38.2% (A) of the break keeping this market very negative and sent it to new lows. The same result happened when it hit 23.6% (B) back to the all-time at 1307.80, that lead to the low for the move. The rally from the December 2015 low went right to 38.2% (1) to the all-time high keeping the market negative, but the break from there failed to produce a new low as was needed to keep the bearish view. The two attempts to make new lows on the breaks from 38.2% went 78.6% back (2) and (3). Having hit 38.2% and failing to make new lows the guidelines say to look for 61.8% of the same move and this was completed at 1590.00 (4). For now the ideal target because we hit 61.8% is to look for it to go 61.8% of the other way and this is 1265.00 (4). As always you have to watch the other retracements on any break to see how weak, or strong the market is.
Jan.17th 2020
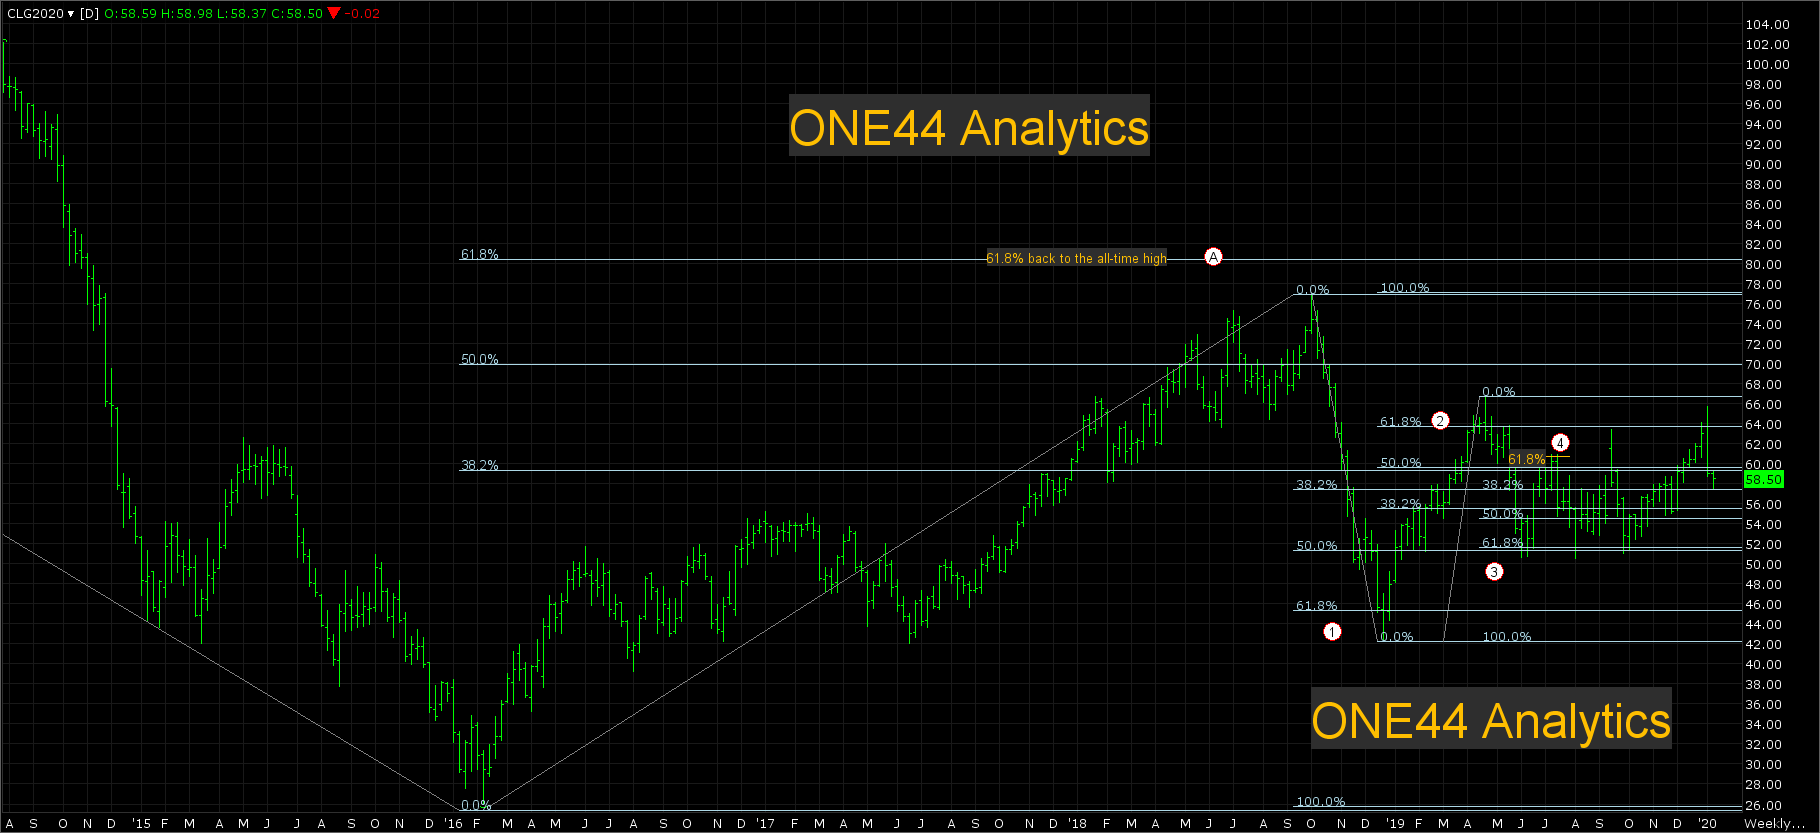
61.8% again and again... Crude Oil
Crude Oil fell a few dollars short of 61.8% (A) back to the all-time high, yet it still had the effect of the 61.8% rule. The break from October 2018 took the market down to 61.8% (1) of the February 2016 low and as the rule indicates we should look for 61.8% of where it just came from. This target (2) was hit in April 2019. Since this was also 61.8% the same thing happened again, with it going 61.8% (3) back the other way in June 2019 and this also lead to another 61.8% retracement (4) in July 2019. Currently the market is caught between the April 2019 61.8% level (2) and the June 2019 61.8% level (3), until either of these can be taken out continue to look for it to have big swing between them.
Jan. 14th 2020
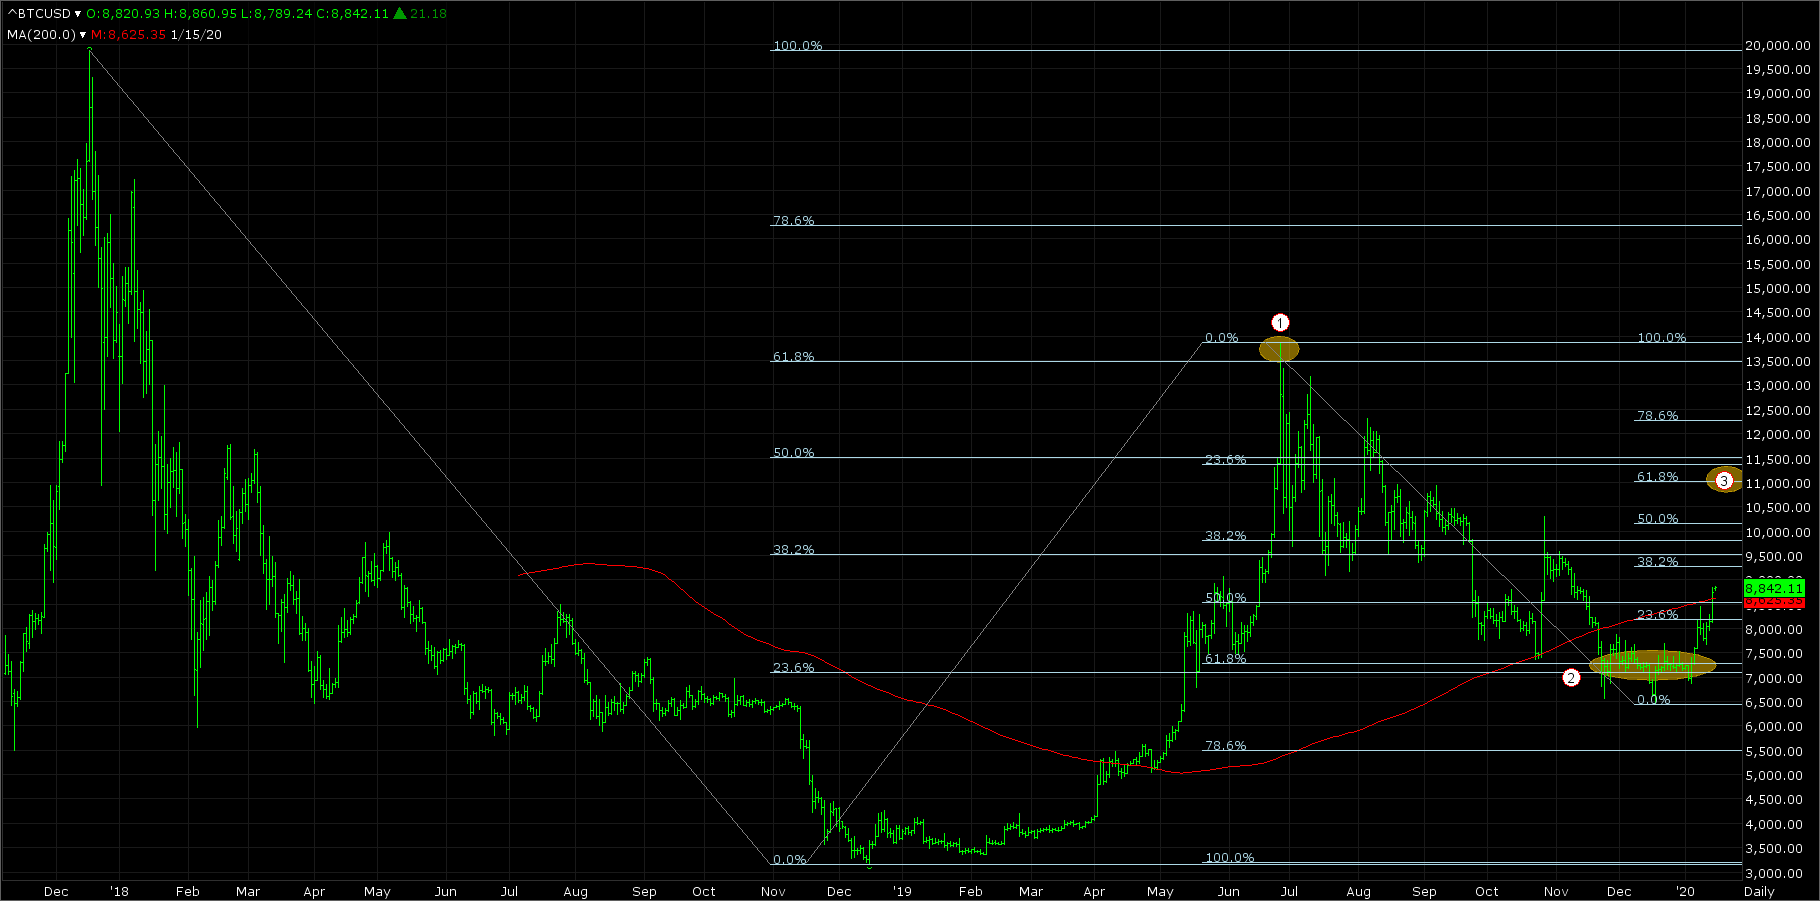
Bitcoin 61.8% to 61.8% to a 61.8% target
The high on 6/26/2019 (1) went 61.8% back to the all-time high, by holding this level it gave us a downside target of 61.8% the other way and this was 7200 (2). Now that they are rallying from this area the next target becomes 61.8% the other way and this is 11030 (3). There were many more retracements in between the 61.8% levels and those will be covered under other rules.
Jan 8th 2020
This IBM example shows the importance of the long term view. The low in February 2016 was 61.8% back (1) to the 2002 low, this gave you an upside target of 61.8% the other way. This was achieved in January 2017 (2). Keeping with this rule the market went 61.8% back again in August 2017 (3) and then again in January 2018 (4).
Currently IBM hit 61.8% back to the 2017 high in July at 153.50 (5) and we are now looking for it to go 61.8% back at 124.00 (A).
