ONE44 Analytics 78.6% rule and examples
Any market that hits 78.6% should go 78.6% back the other way.
When a market does react to 78.6% it usually creates wide swings that go through all the other retracements, this either happens in very large trading ranges or very small, it is also the level hit most often when the market is reacting from 23.6% and 38.2% and fails to make the new high/low.
MAY 3rd 2020
NQM20
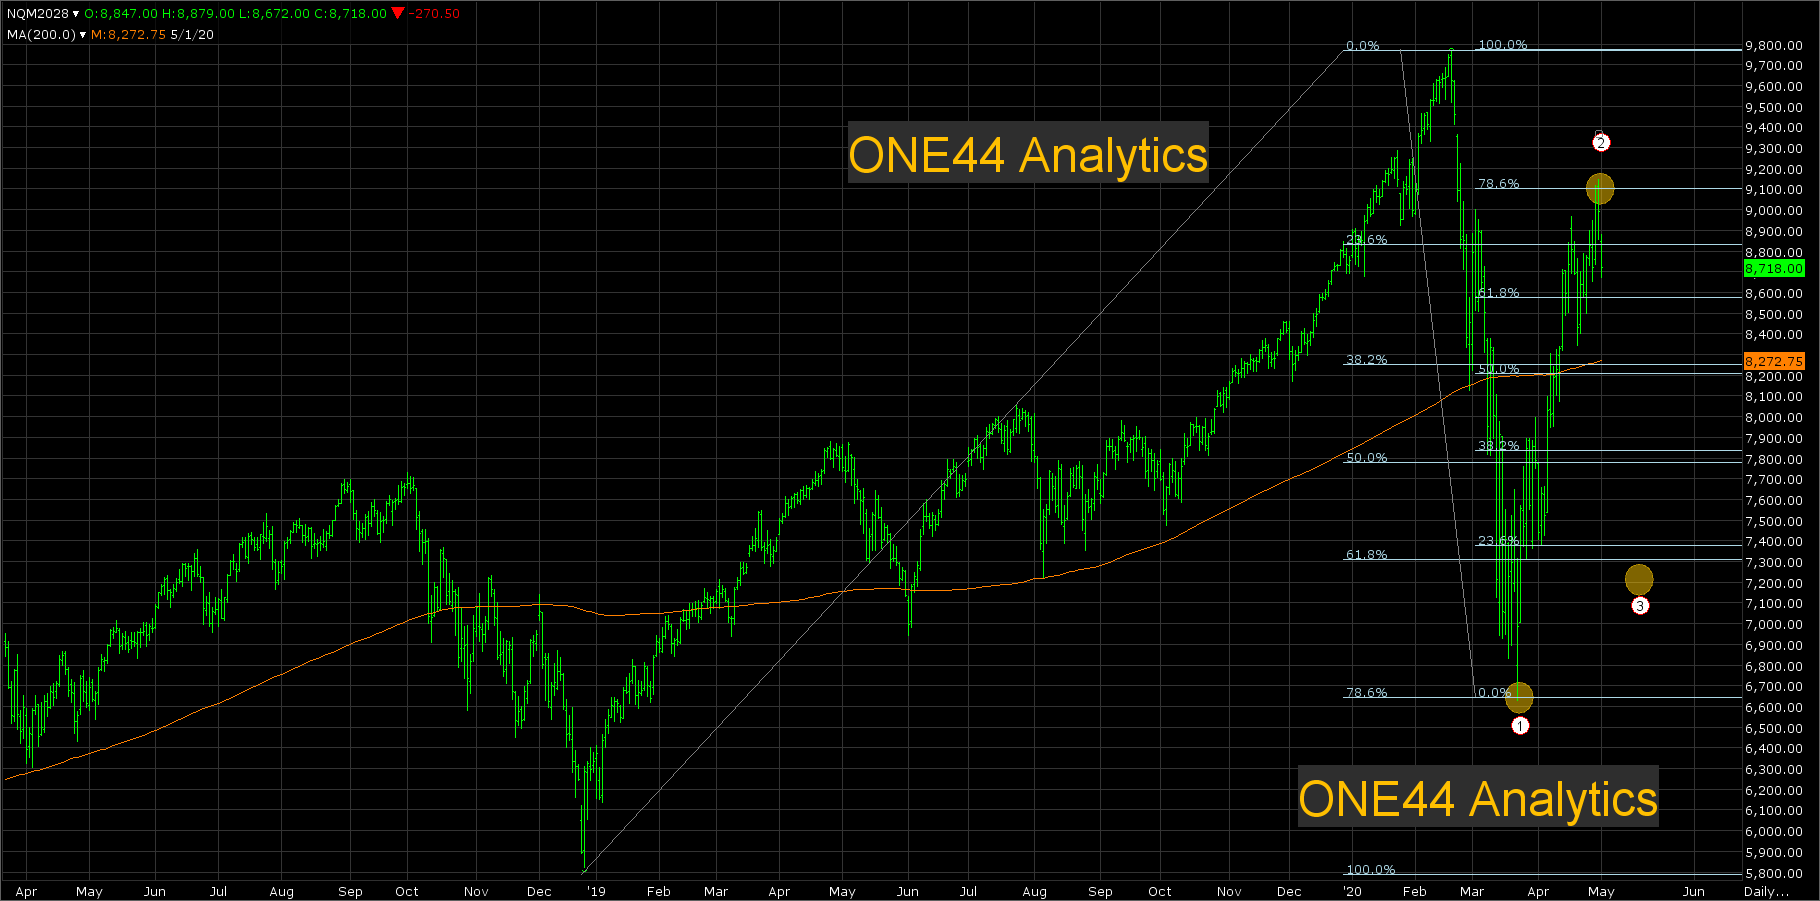
This example deals with NQM20 daily chart and the ONE44 78.6% rule.
When we use the last long term direct move up from the Dec. 2018 low to the all-time high, you can see that the bottom on 3/23/20 retraced 78.6% of this move at 6645.00 (1). You can also see that the biggest rally on this massive break came at the 38.2% level at 8250.00 and if you went back even father in time you would see other retracements that came into play, but to keep the chart clean we are just going to use the most recent levels. As we said the low on 3/23/20 was 78.6% and the 78.6% rule states as follows, that any time 78.6% is hit you should look for a return retracement of 78.6%. From this low that target would have been 9100.00 (2). At that time it did seem like an outrages target, but that is exactly where it went. So, now we have the same scenario in the opposite direction, because 9100.00 is 78.6% we will look for the same in reverse. The target is 7200.00 (3). This too seem like a outrages call, it could happen quickly, or it can take months, time will tell. As always we will watch all the retracement on a break from 9100.00 to see just how weak, or strong this market is.
Feb. 4th 2020
ZBH20 Outlook
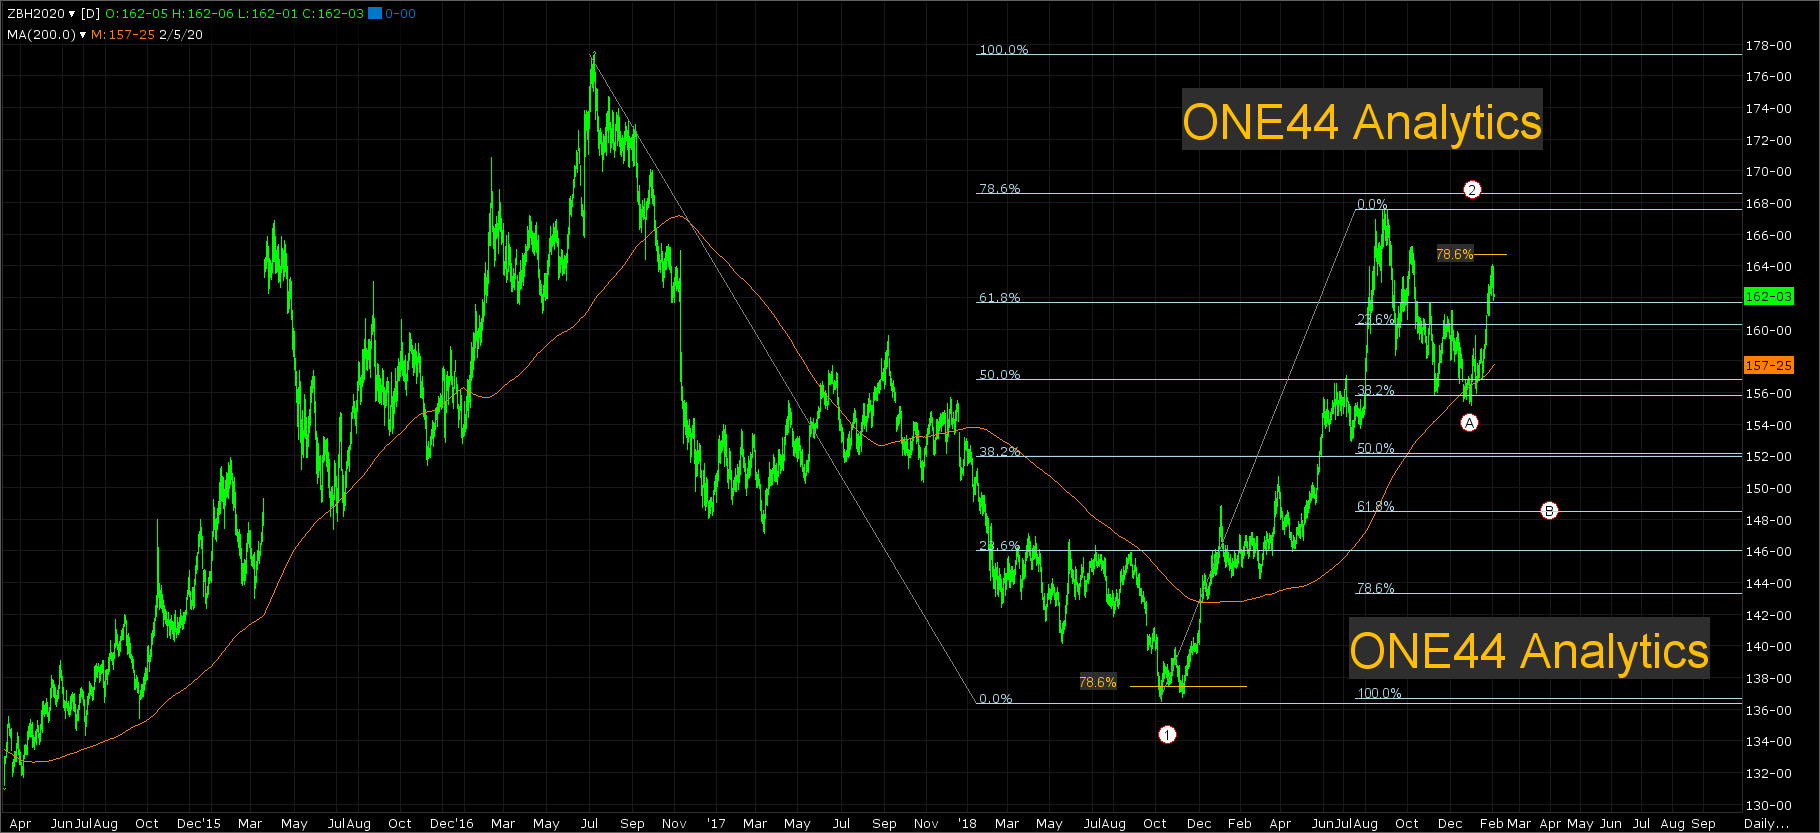
The current rally in ZBH20 is coming from 38.2% (A) back of the 10/19/2018 low and the 8/2/2019 high, this was 155.27. The target from here should be new highs for the move per the 38.2% rule. As you look farther out there is another move playing out and this is the low October 2018 was 78.6% (1) of the January 2014 low and the July of 2016 high. From the 78.6% rule the target is 78.6% (2) back of the move it just came from and this is 168.30, so with this move we are still looking for a new high of the current move. The other things to watch for on a rally from 38.2% (A) is 78.6% of the last break, this is 164.28 and then 78.6% (2) of the bigger move. A break from either of these levels would be one of two things, 1) a failure to make a new high and 2) making only a slightly higher high, both of these things are a negative sign and the target on a break from them would be 61.8% (B) of the same move where 38.2% held.
Jan. 24th 2020
78.6% the end of the trend, DAX
You will often see when a 78.6% retracement holds it comes at the end of extended runs. When the DAX made a low on 2/11/2016 it had been making lower highs and lower lows from the 4/10/2015 high. The end of the lower lows came on 6/24/2016 (1) at 78.6% of the recent rally, this level was the turning point for the current down trend. The breaks on the rally from there (1) started to hold all the key retracements. The low on 11/9/2016 held 38.2% (2) and this sent it on to new highs. The second setback on 8/29/2017 hit 23.6% (3) this also sent it on to new highs. The last major retracement that held on 3/5/2018 was 38.2% (4) back to the 2/11/2016 low. The rally from there failed to make a new high for the move and then also hit 78.6% (5) and this led to the eventual end of the up move, just as it did on the the low (1).

Jan. 19th 2020
78.6% again and again, Wheat
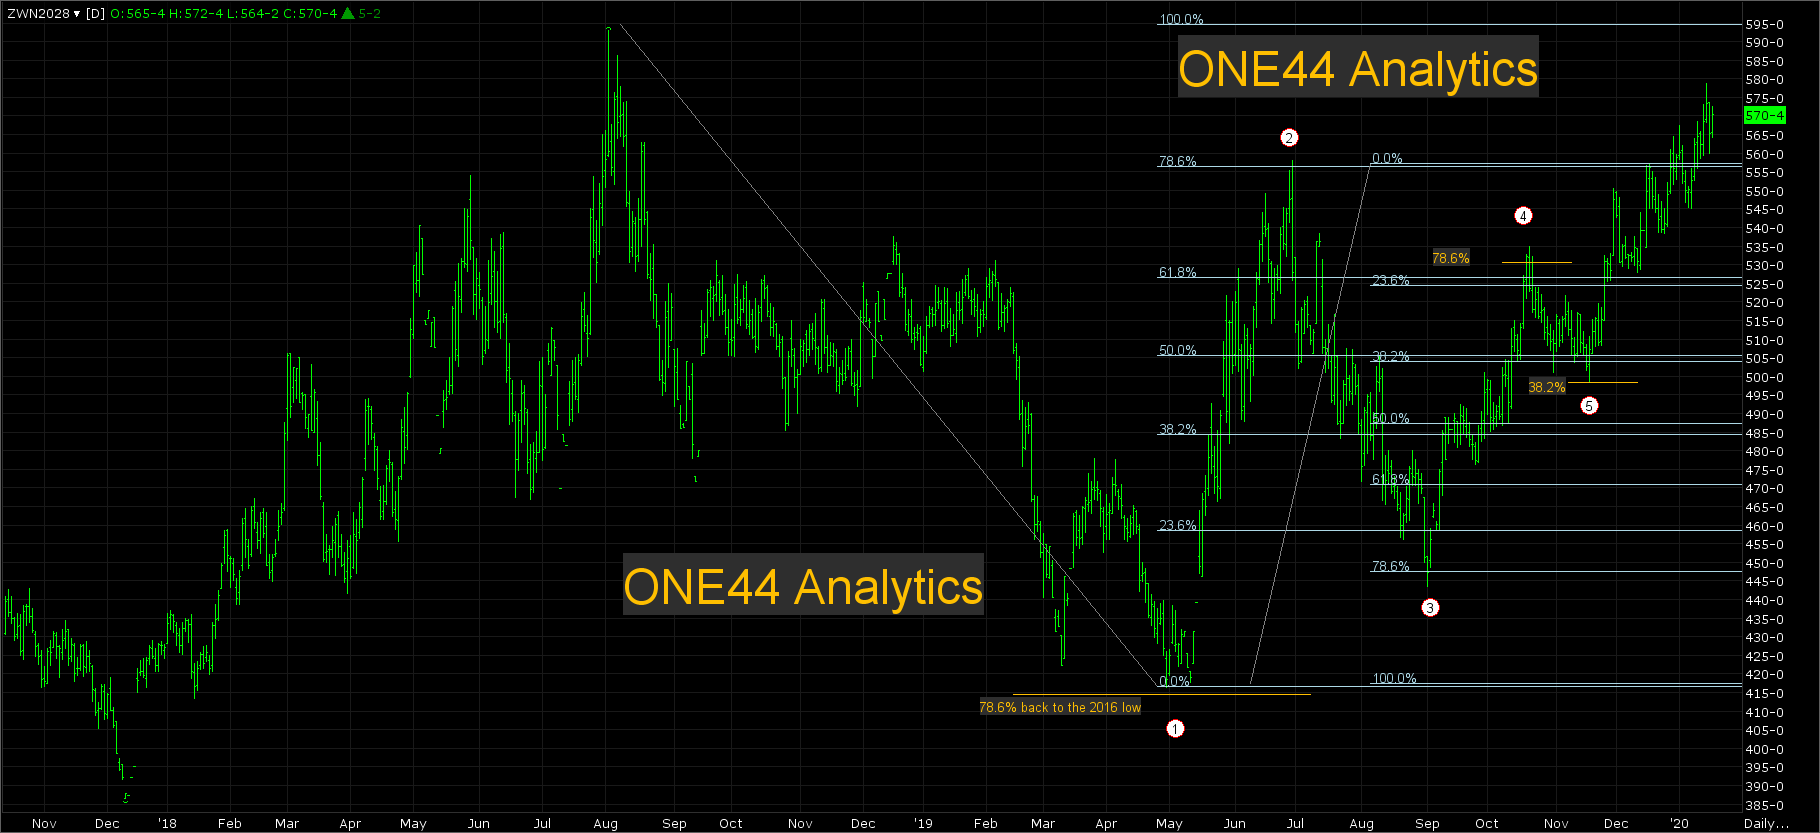
The Daily Wheat chart starts out with the May 2019 (1) low being 78.6% back from the August 2018 high to the 2016 low. This tells us to look for 78.6% back of where it just came from and this target was achieved on June 28th 2019 at 557.00 (2). Being that this was also 78.6% the target from there was 78.6% back of that rally and this target was completed on September 3rd 2019 at 447.00 (3) and again, this was 78.6% so the target is to look for 78.6% the other way and this happened on October 21st 2019 at 531.00 (4). The ideal target on a break from there should be 78.6% the other way and as always you have to watch every retracement on all moves to see just how weak, or strong the market is regardless of the target. In this case it held 38.2% at 500.00 (5) of the rally and went on to new highs as it should letting us know it has found a new direction and ended the wide swings. On any break from these new highs watch the 23.6% level back to the May 2019 low to see if the market remains very strong and then 38.2% to see if the trend is intact or is changing.
Jan.18th 2020
All markets adhere to the same rules, Shanghai composite
This is another example of the 78.6% rule in a very large trading range in price and time. It also shows that it doesn't matter what market, or what Exchange it is on, they all follow the same rules. The low in 2008 in the Shanghai Composite hit 78.6% (1) back to the all-time low, this gave us a long term target of 78.6% the other way at 5180.00, the target was hit 7 years later (2). That set up another long term target of 78.6% the other way at a price of 2500.00 that was hit 4 years later (3) and this now gives us a long term target of 78.6% the other at 4600.00 (4).
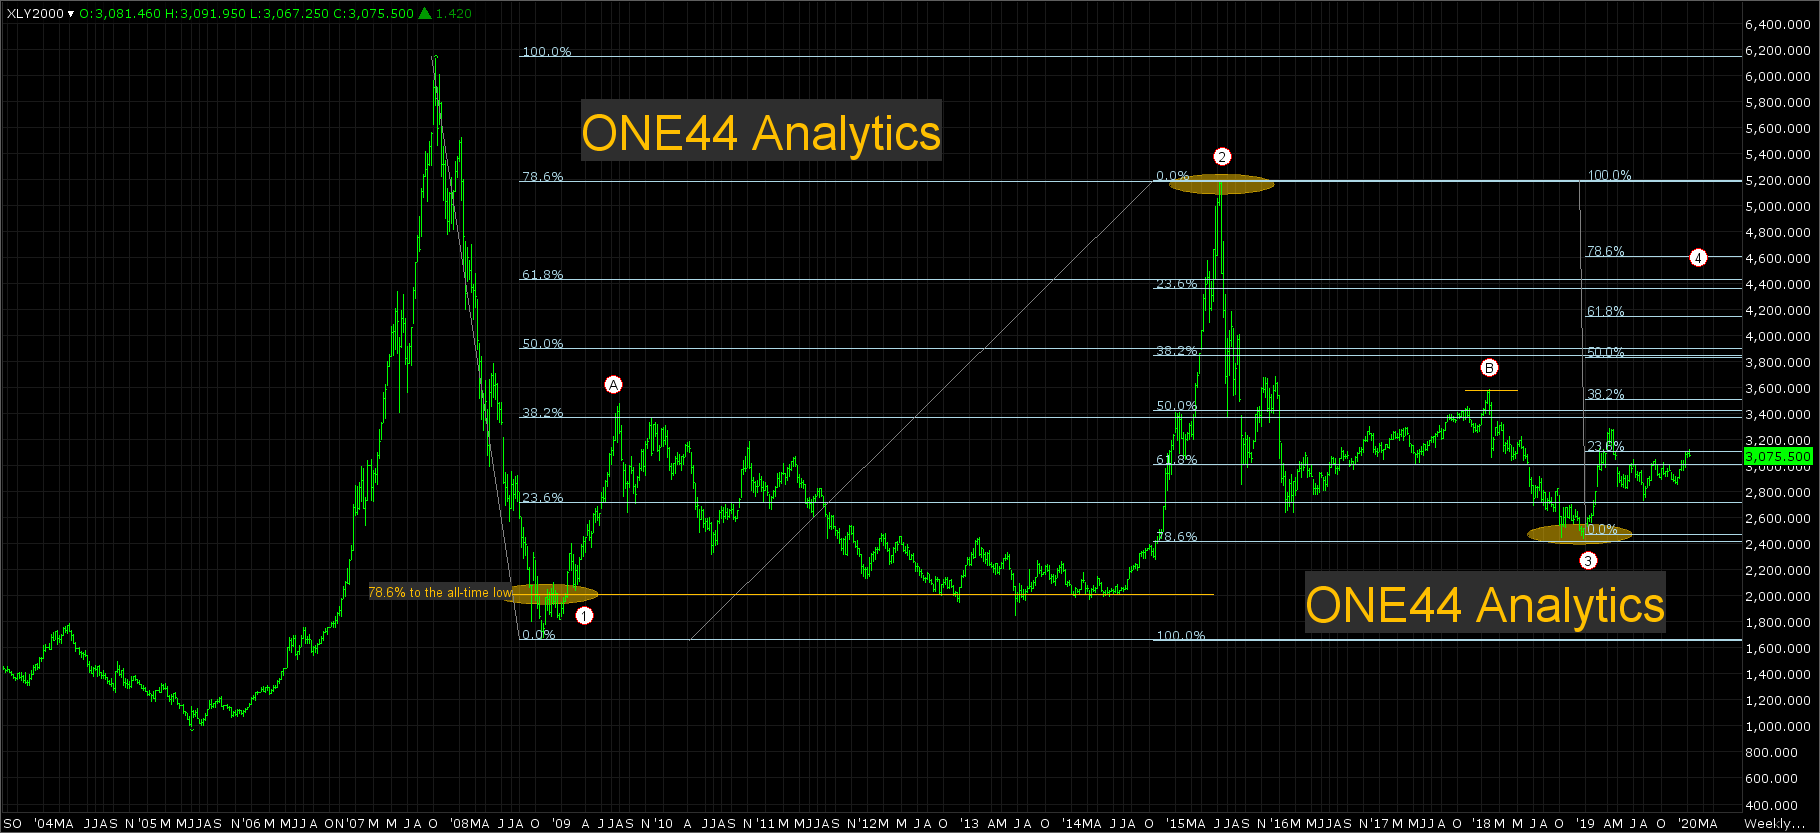
In between these moves the first rally from the 2008 low took it back to 38.2% (A) keeping the market in a negative posture despite our long term target of 5200.00, but the failure to make a new low in 2013 from 38.2% told us a possible turn in the trend is coming and the next rally sent it up to the long term target. The rally in to Jan. 2018 hit 38.2% (B) keeping this market negative and the long term target of 2500.00 possible, it did make a new low from there and the target was then hit.
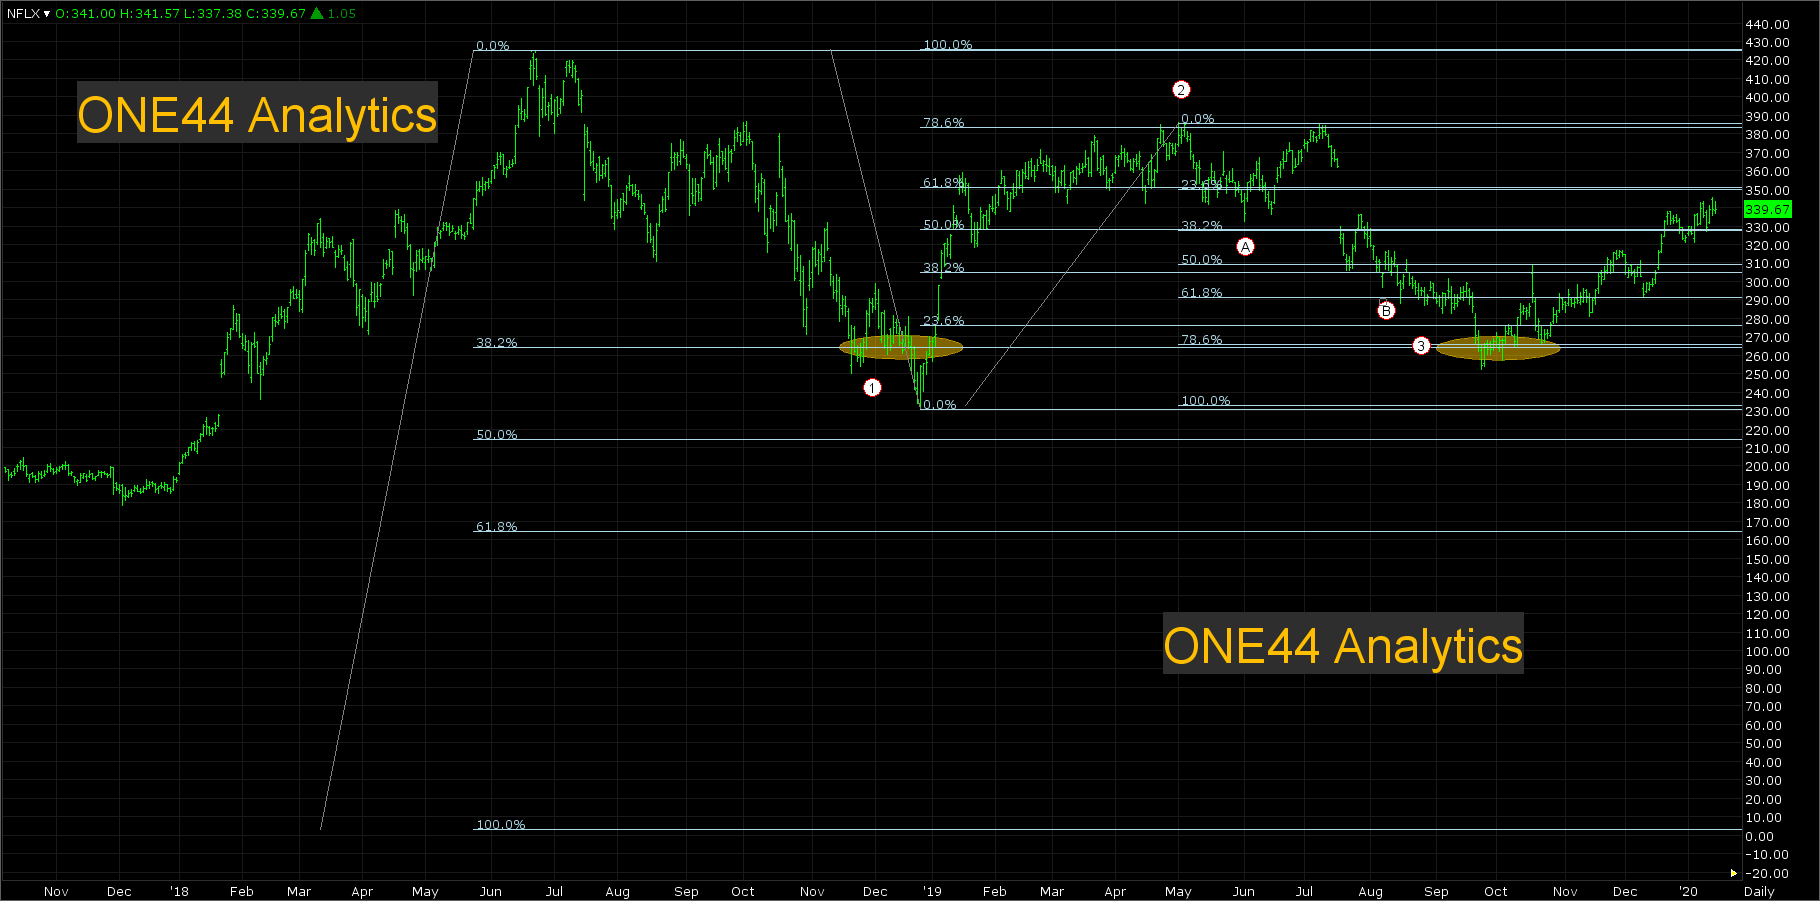
Big swings with 78.6%
In this NFLX example we are dealing with a very large range. On 5/1/2019 (2) they hit 78.6% of the 6/21/2018 high and the 12/26/2018 low. The long term target on a break from this level was 78.6% back of the 12/26/2018 low and the 5/1/2019 high, this target was hit on 9/23/2019 (3). As always you will still watch all the retracements and how they react to them on the break, in this case you can see they held above 38.2% (A) but failed to make a new high, this was a signal in it's self that said a change in trend is possible and that on any break to look for 61.8%. The reaction from 61.8% was only $20 before going on to 78.6%.