Another Viewer Request, Magellan Midstream Partners, L. P.
ONE44 Analytics where the analysis is concise and to the point
Our goal is to not only give you actionable information, but to help you understand why we think this is happening based on pure price analysis with Fibonacci retracements, that we believe are the underlying structure of all markets and Gann squares.
Viewer request
This article will go over Magellan Midstream Partners, L. P.
Here is a quick set of guidelines for the Fibonacci retracements to help with this article. You can find all the rules/guidelines and examples on any deviations from these four basic rules on our website.
1) The Golden rule, any market that is going to continue the current trend must hold 38.2% and a new high/low should follow.
2) Markets that are extremely strong/weak will only go 23.6% and a new high/low should follow. Typically a runaway market.
3) The 61.8% rule is, any market that holds 61.8% should go 61.8% of where it just came from. Usual happens when a market is directionless, or in a consolidation period.
4) The 78.6% rule is, any market that holds 78.6% should go 78.6% of where it just came from. This is also where a lot of Bull markets end and start.
Charts are courtesy of Barchart.com
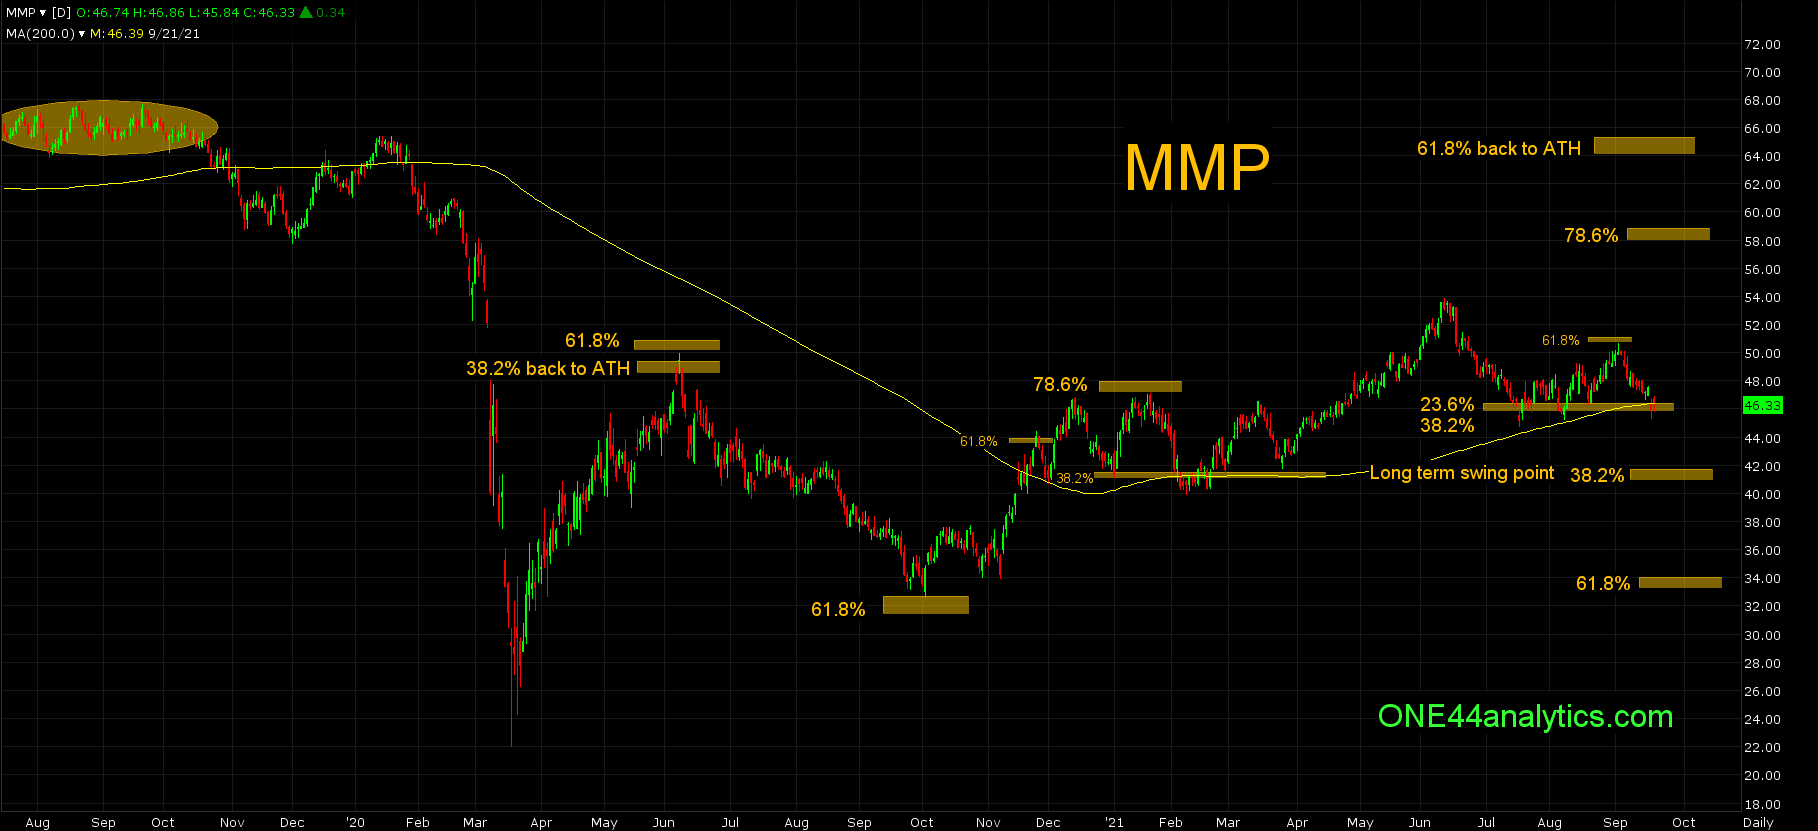
Starting with the first high after the 3/18/20 low we can see on the chart the rally stopped at two big retracements. The first is 38.2% back to the ATH and the second is 61.8% back to the 8/21/19 high.
By staying below 38.2% back to the ATH the long term trend remained negative and following the ONE44 Fibonacci rules and guidelines, it needs to make a new low for the move to keep the trend negative and any failure to do so should send it to 61.8% of the same move, more on that later. With it also being 61.8% back the 2019 high, the target would be 61.8% of where it just came from based on those rules and guidelines.
This was achieved on 10/2/20 at 32.65. Again using the 61.8% rule we should be looking for at least 61.8% the other way and this happened on 11/25/20. The setback from there was minor and after making a new high for the move the setback hit 38.2% on 1/4/21. The rally from it hit 78.6% on 1/21/21, the break from it traded below 38.2% of the move up from the 10/2/20 low for 11 trading days, but never fell apart as you might expect. Once back above 38.2% it retested the 78.6% area and then came back to 38.2% of the move on 3/26/21 before going on to new highs for the move.
Now that it has taken out the 6/8/20 high we start to retrace back to the 3/18/20 low as well as the 10/2/20 low. Also by taking out that high that was 38.2% back to the ATH, we can start to look for 61.8% of the same up at 64.10, this would be the long term target. With the 6/8/20 high also being 61.8% back to the 8/21/19 high we can look for 78.6% of the same move at 58.00 for a short term target.
Currently,
It is sitting on 23.6% of the 3/18/20 low and 38.2% of the 10/2/20 low, this area is 46.40 to 45.90. To remain very positive this is what you want to see hold. They traded at this level for 4 weeks and then hit 61.8% back to the 6/11/21 high on 9/2/21 and are now at it again. It would have to take out 38.2% of the whole move up at 42.00 to turn the trend negative and if so you can look for 61.8% at 34.00. Look for the short and long term targets mentioned above as long as it remains above 38.2% of the March 2020 low.
Sign up for our Free newsletter here.
FULL RISK DISCLOSURE: Futures trading contains substantial risk and is not for every investor. An investor could potentially lose all or more than the initial investment. Commission Rule 4.41(b)(1)(I) hypothetical or simulated performance results have certain inherent limitations. Unlike an actual performance record, simulated results do not represent actual trading. Also, since the trades have not actually been executed, the results may have under- or over-compensated for the impact, if any, of certain market factors, such as lack of liquidity. Simulated trading programs in general are also subject to the fact that they are designed with the benefit of hindsight. No representation is being made that any account will or is likely to achieve profits or losses similar to those shown. Past performance is not necessarily indicative of future results.