Beans, Corn and Fibonacci
ONE44 Analytics where the analysis is concise and to the point
Our goal is to not only give you actionable information, but to help you understand why we think this is happening based on pure price analysis with Fibonacci retracements and Gann squares.
You can get all the rules and guidelines to the Fibonacci retracements on our website.
Soybeans
ZSX21
The Soybeans have been adhering to the ONE44 Fibonacci rules and guidelines perfectly. To start we can go back to the low on 6/17/21 (1), it held above 38.2% of the June high and the 2020 low. This level is 1230.00, on the Nearby chart the July contract hit 38.2% (our long term swing point), this was 1347.00, they traded below it, but never had two closes in a row below it.
Following the 38.2% rule we know that the target after holding this area is new highs, however we watch all the retracements on any move to see just how strong, or weak the market is. The first rally from the 6/17/21 low hit 38.2% (2) back to the high putting a hold on the rally to new highs. The break from 1330.00 failed to make a new low (3) and using the ONE44 rules we know that any failure to make a new low, or a slightly lower low after holding 38.2% should send it up to 61.8% to start. There is one more level to watch before new highs and this is 78.6% (4). This is the retracement where a lot of bull runs end. A break from this area can send it back to 78.6% of where it just came from and this is 1280.00 (5). Provided it can close above 1427.00, look for new highs and then the 1587.00 major Gann square.

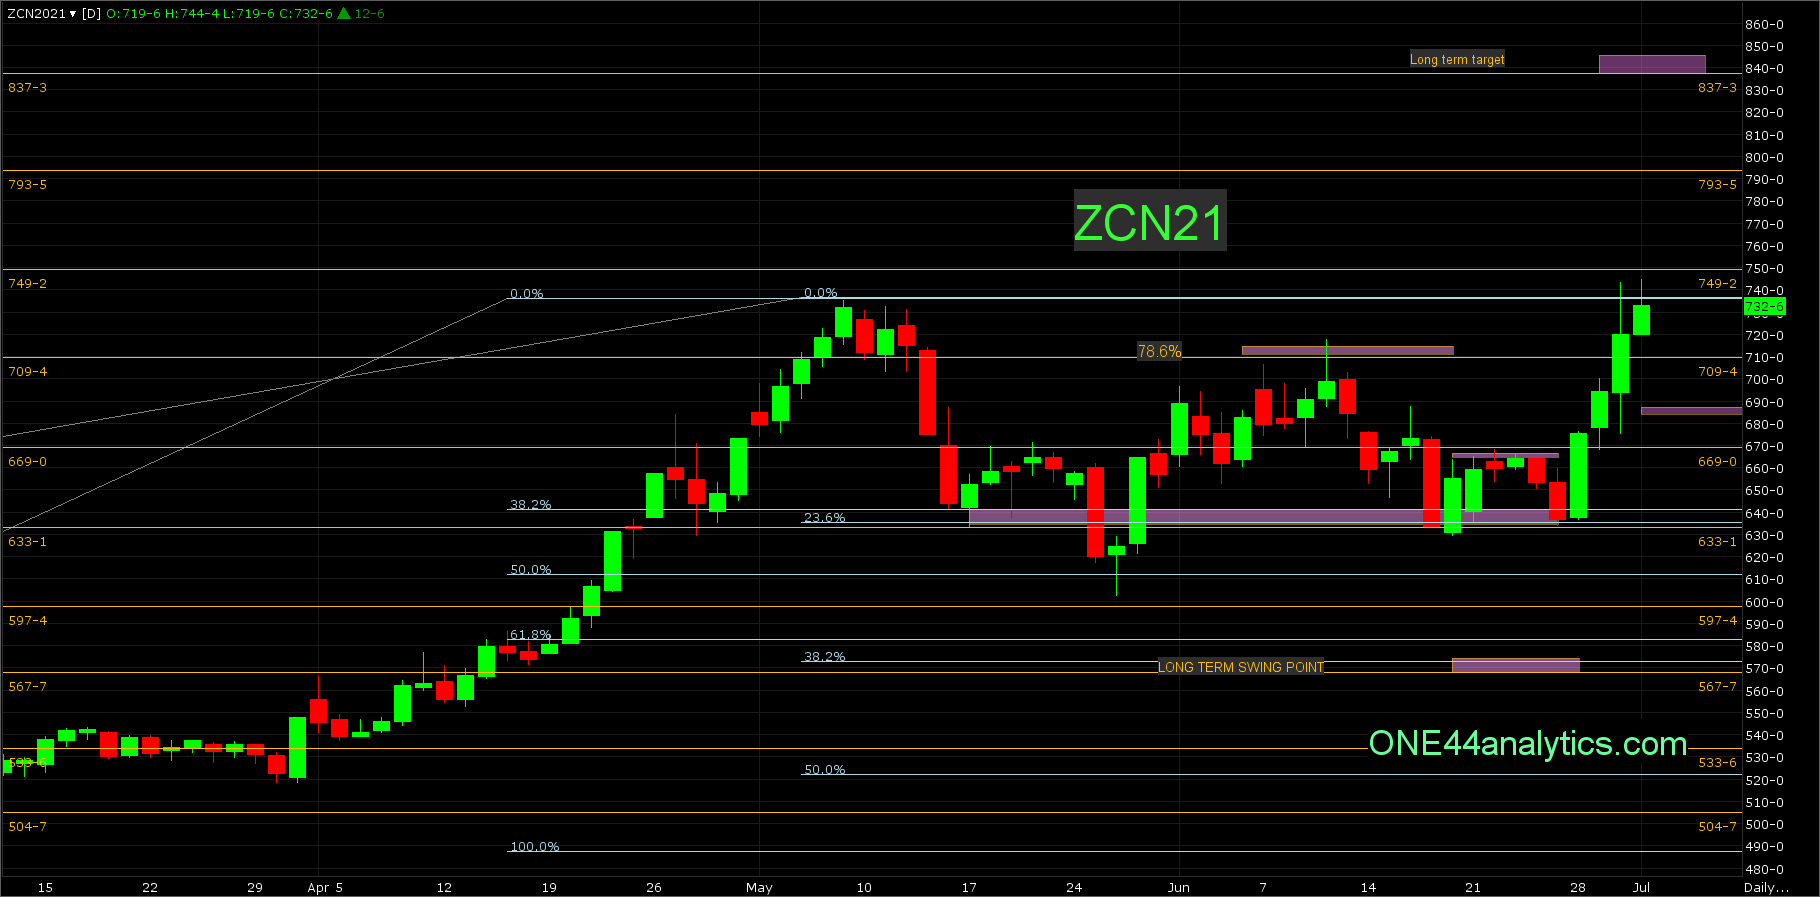
ZCN21
Using the Nearby chart in Corn, the low on the 18th held 23.6% back to the 2020 low and the major Gann square of 633.00. Like the Beans, the rally from that low hit 38.2% at 664.00 and then failed to make a new low, telling us to look for the highs again. It has now made new highs and the long term target is 837.25. The market should hold above 38.2% of the rally from the 5/26/21 low to keep the trend positive, this is 690.00.