Bitcoin
ONE44 Analytics where the analysis is concise and to the point
Our goal is to not only give you actionable information, but to help you understand why we think this is happening based on pure price analysis with Fibonacci retracements and Gann squares.
You can get all the rules and guidelines to the Fibonacci retracements on our website
Bitcoin
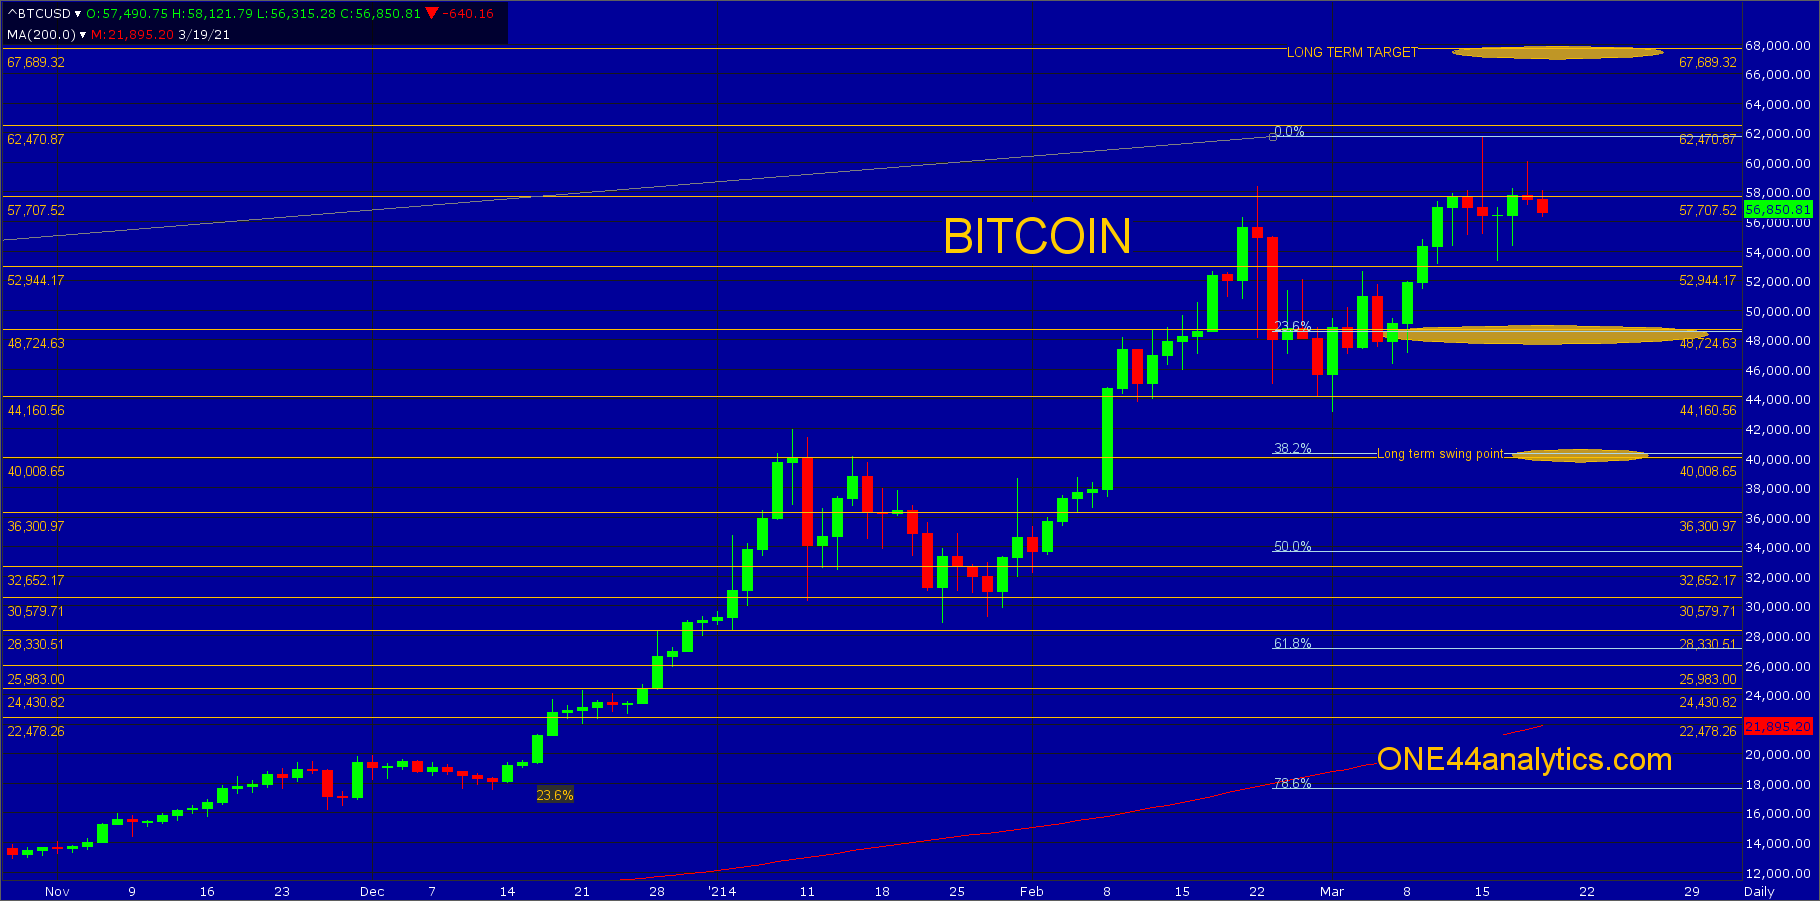
Bitcoin continues to be unable to get a solid close above the 57700 major Gann square. The first break from this area took it down to 45275, this is 23.6% back to the 2018 low and the 44160 major Gann square, they traded below, but never closed below. The rally from there took them well above the 57700 major Gann square, but they failed to close above it.
As long as they remain below 57700 look for the 48720 major Gann square, this is also 23.6% back to the 2018 low. The long term swing point is now 40000, this is a major Gann square and 38.2% back to the 2018 low.
The new long term target above is the 67700 major Gann square, once they can get a solid close above 57700. There is one other major Gann square to look for resistance up at 62470.
In between the long term levels you can use the W.D. Gann Law of Vibration chart for support and resistance marked by the yellow horizontal lines. Chart below.
Sign up for our Free newsletter here.
This is our latest video in an ongoing series of how to use the Fibonacci retracements. Even if you do not trade the market covered the rules and guidelines are the same, as we believe the Fibonacci retracements are the underlying structure of all markets.
https://www.youtube.com/watch?v=8THwUxnhrvE&t=472s&ab_channel=ONE44Analytics