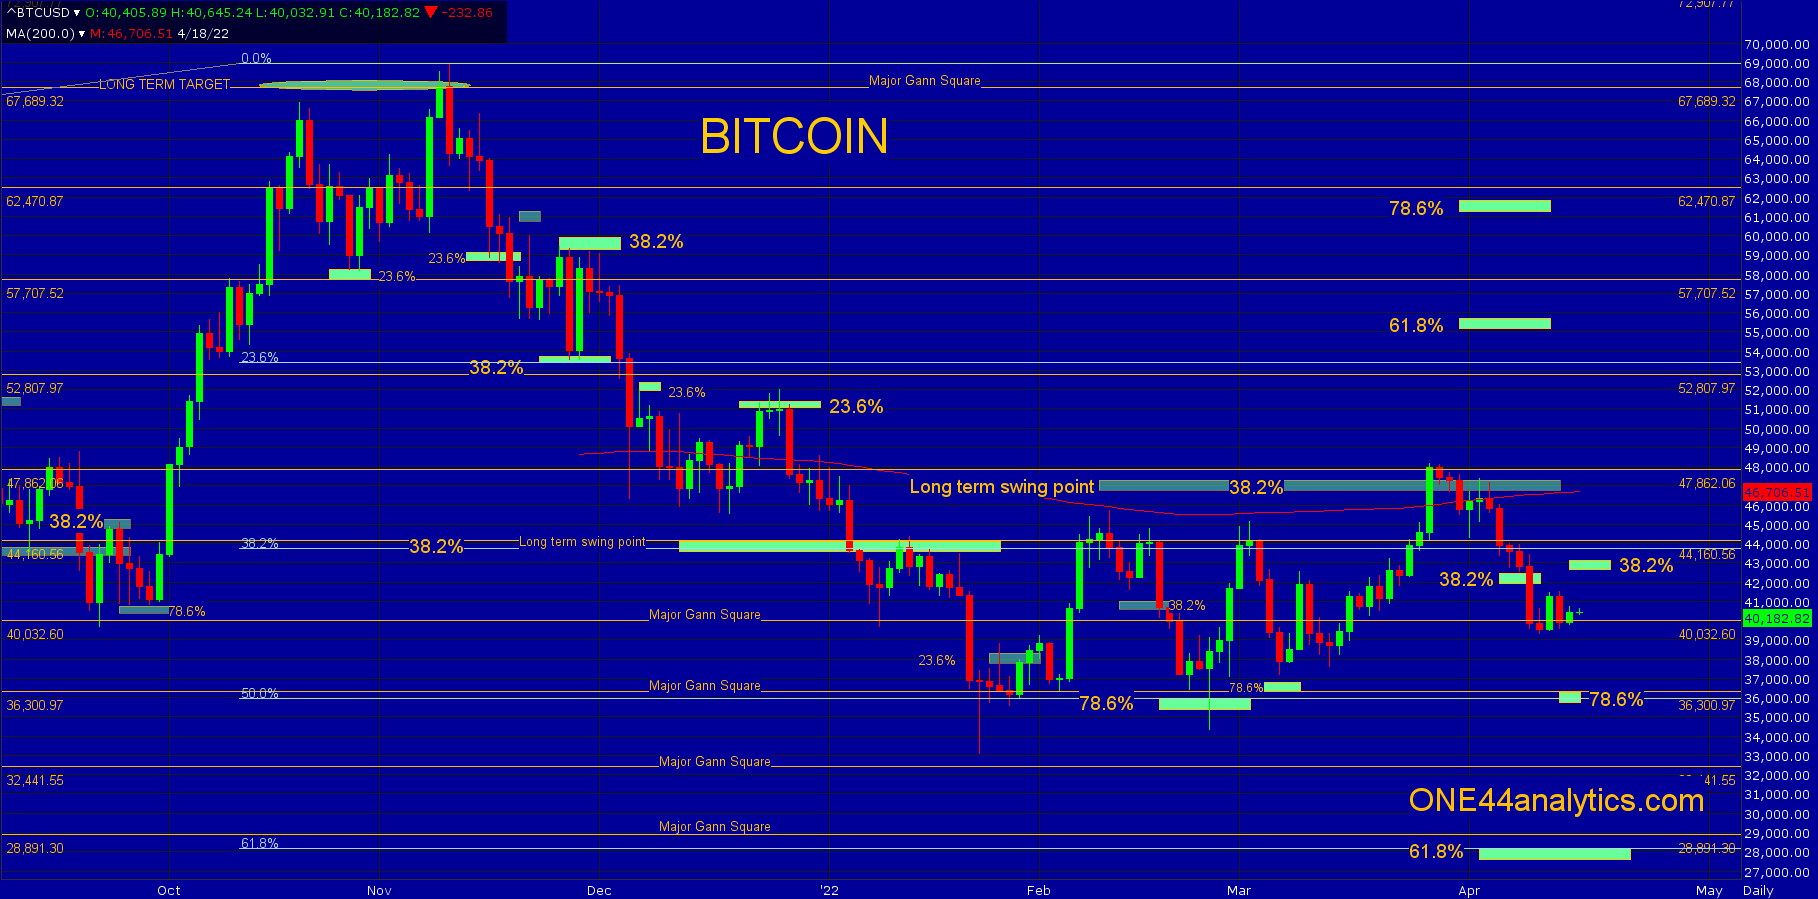
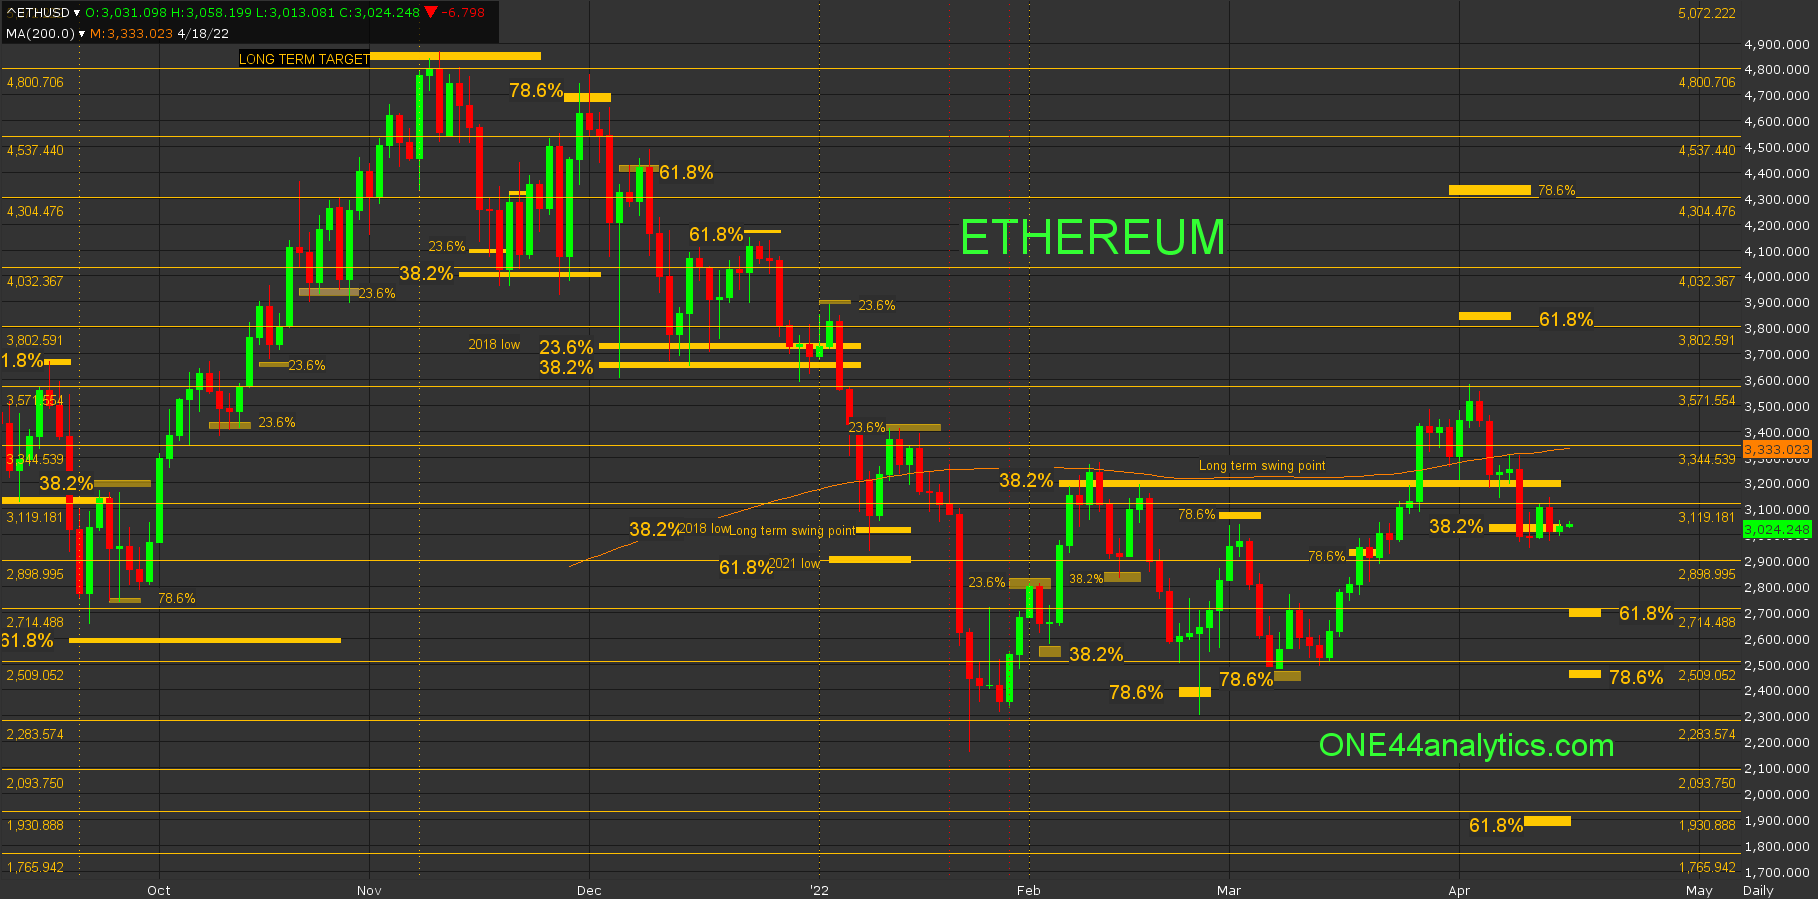
Bitcoin and Ethereum are below their long term swing point with targets of 28,000 and 1900.00

ONE44 Analytics where the analysis is concise and to the point
Our goal is to not only give you actionable information, but to help you understand why we think this is happening based on pure price analysis with Fibonacci retracements, that we believe are the underlying structure of all markets and Gann squares.
Charts are courtesy of Barchart.com
Bitcoin
Bitcoin failed to stay above the long term swing point and has also taken out 38.2% of the rally up to the long term swing point, this was 42,250. It is now sitting on the 40,032 major Gann square. You can use 38.2% of the break at 42,600 as the short term swing point, above it look for the long term swing point and below it 78.6% at 36,300, this is also a major Gann square. Failing to hold 36,300 should send it down to the long term target of 61.8% at 28,000.
Ethereum
Ethereum got well above the long term swing point, however it hit the 3571.00 major Gann square and is now back below it. On the positive side it is holding right at 38.2% of the current rally at 3040.00. A rally from here that can get it back above the long term swing point and the 3344.00 major Gann square, that is also the 200 day average should send it to 61.8% back to the ATH at 3830.00. The ideal target below 3040.00 would be 78.6% at 2475.00, however you also have to watch 61.8% at 2714.00, because it is a major Gann square and it is the stronger market of the two right now based on the retracements.
You can get all the Gann Law of Vibration charts for Bitcoin, Ethereum, Litecoin, Solana, Cardano, Ripple and Dogecoin HERE These charts are very useful for short term support and resistance.
(LTCUSD) (ADAUSD) (SOLUSD) (DOGEUSD) (XRPUSD)
Sign up for our Free newsletter here.
FULL RISK DISCLOSURE: Futures trading contains substantial risk and is not for every investor. An investor could potentially lose all or more than the initial investment. Commission Rule 4.41(b)(1)(I) hypothetical or simulated performance results have certain inherent limitations. Unlike an actual performance record, simulated results do not represent actual trading. Also, since the trades have not actually been executed, the results may have under- or over-compensated for the impact, if any, of certain market factors, such as lack of liquidity. Simulated trading programs in general are also subject to the fact that they are designed with the benefit of hindsight. No representation is being made that any account will or is likely to achieve profits or losses similar to those shown. Past performance is not necessarily indicative of future results.