Bitcoin, Ethereum continue to break from our long term targets
ONE44 Analytics where the analysis is concise and to the point
Our goal is to not only give you actionable information, but to help you understand why we think this is happening based on pure price analysis with Fibonacci retracements, that we believe are the underlying structure of all markets and Gann squares.
For the ONE44 Fibonacci rules and guidelines to help with this article, go here.
Charts are courtesy of Barchart.com
We have a new video explaining how to use the Fibonacci retracements based on the ONE44 rules and guidelines. Even if you do not trade the markets in it, the rules are the same for ALL markets.
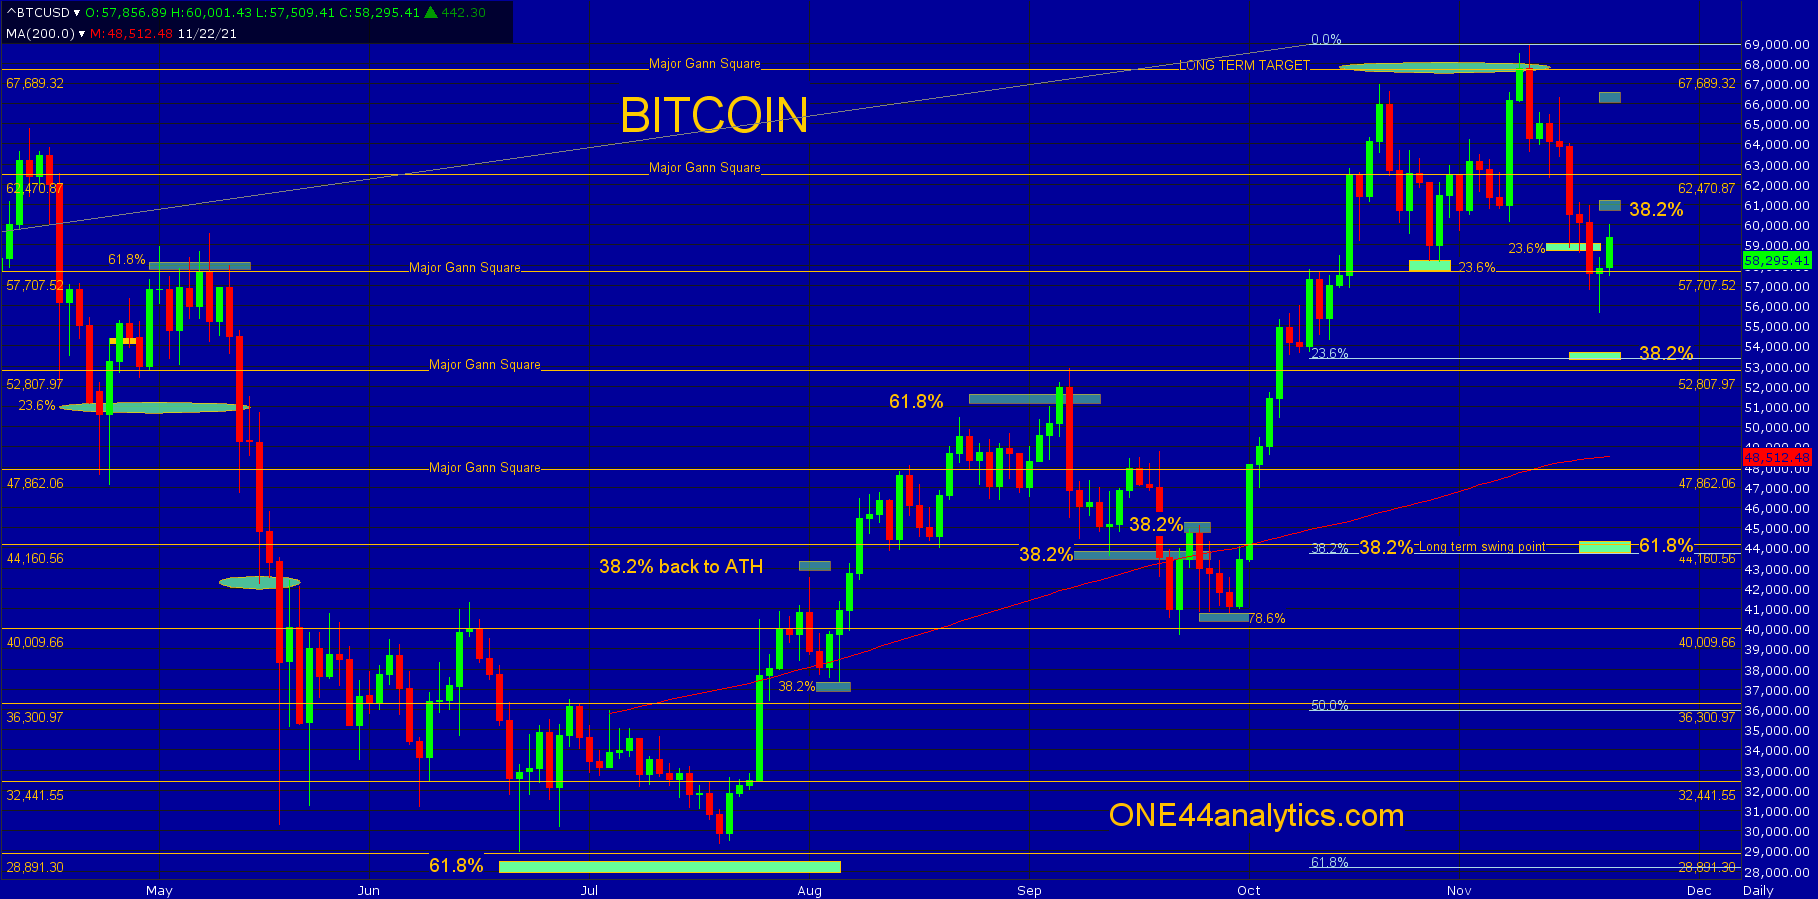
Bitcoin
The break so far from the long term target has taken out 23.6% back to the 6/22/21 low. The bigger area of support is down between 59.500 and 53,400, this is 38.2% back to the 6/22/21 low and 23.6% back to the 2018 low, with a major Gann square at 52,800. If there were to be a washout move, look for 44,200 to 43,750 this is 38.2% and 23.6% of those same moves and a major Gann square at 44,160. With this current rally the short term swing point is 38.2% back up at 60,700. A failure to get, or close above here keeps the short term trend negative and you can look for the levels just mentioned. Above 60,700 look for 78.6% of the same move at 66,000.
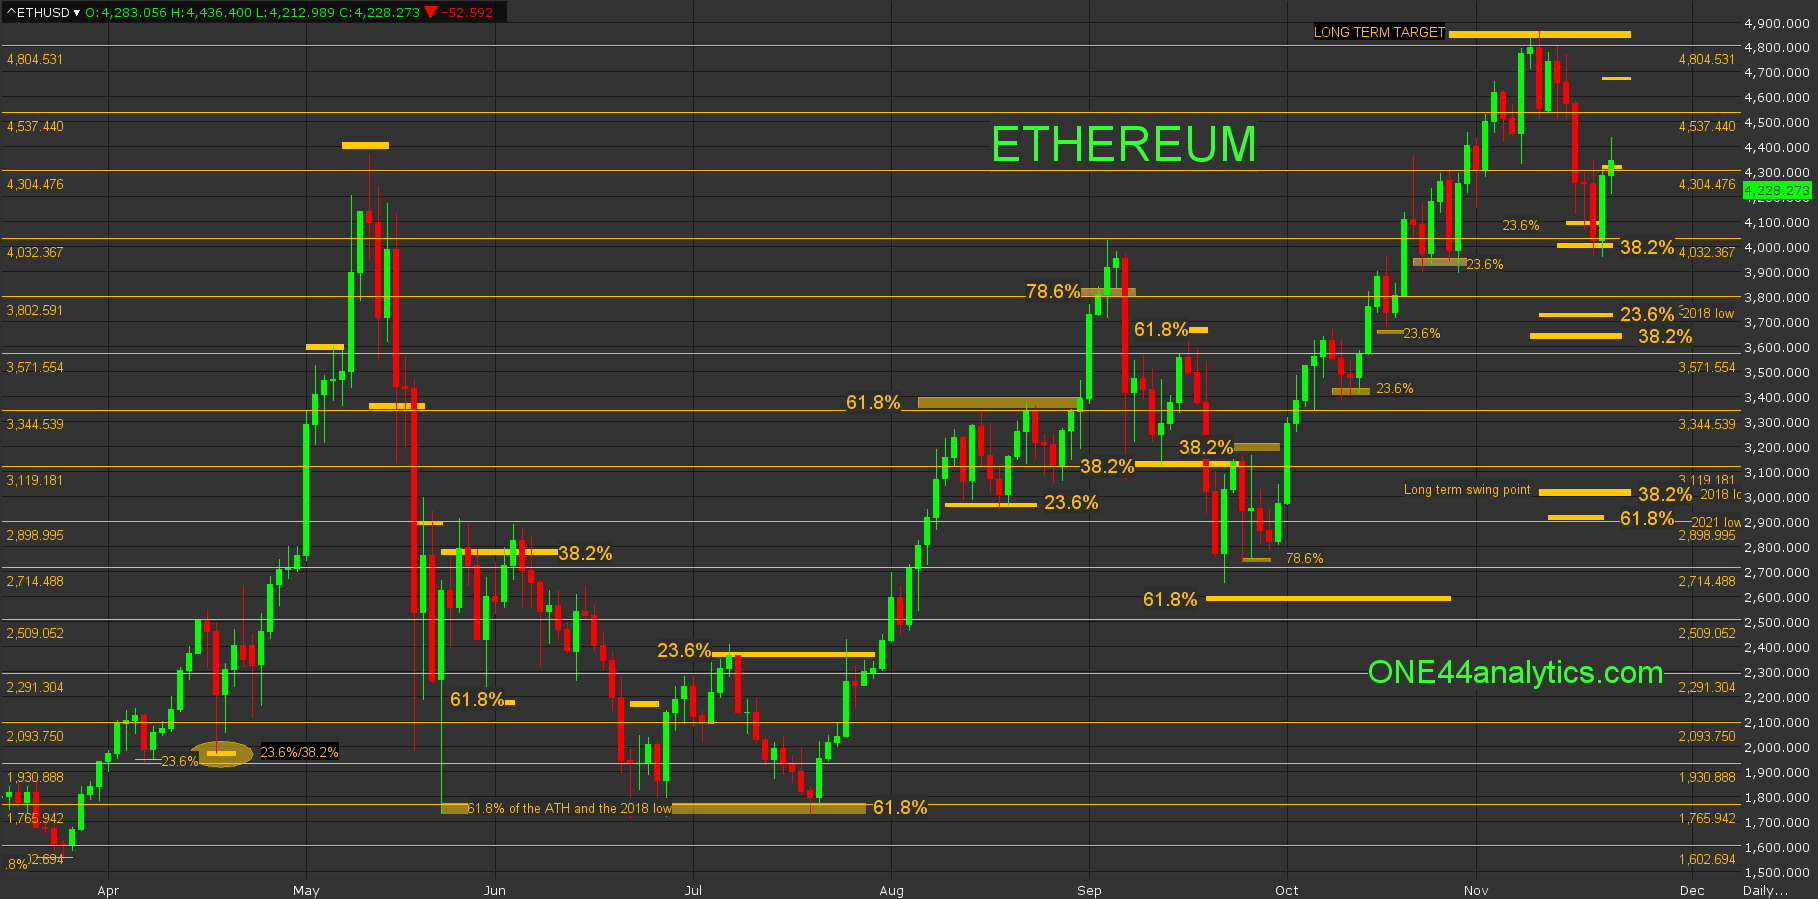
Ethereum
The current low held 38.2% of the 9/22/21 low, this was 4010.00 and the rally from it is now above 38.2% of the move down at 4320.00, use this as the short term swing point. Above it, look for 78.6% at 4575.00. Getting right back below it should send it down to the area of 3740.00 and 3654.00, this is 23.6% back to the 2018 low and 38.2% back to the 6/22/21 low. On a crazy break, look for the long term swing point at 3030.00.
Sign up for our Free newsletter here.
FULL RISK DISCLOSURE: Futures trading contains substantial risk and is not for every investor. An investor could potentially lose all or more than the initial investment. Commission Rule 4.41(b)(1)(I) hypothetical or simulated performance results have certain inherent limitations. Unlike an actual performance record, simulated results do not represent actual trading. Also, since the trades have not actually been executed, the results may have under- or over-compensated for the impact, if any, of certain market factors, such as lack of liquidity. Simulated trading programs in general are also subject to the fact that they are designed with the benefit of hindsight. No representation is being made that any account will or is likely to achieve profits or losses similar to those shown. Past performance is not necessarily indicative of future results.