Bitcoin, Ethereum explode from 78.6%

Any market that hits 78.6% should go 78.6% back the other way. This is also where a lot of Bull markets end and start.
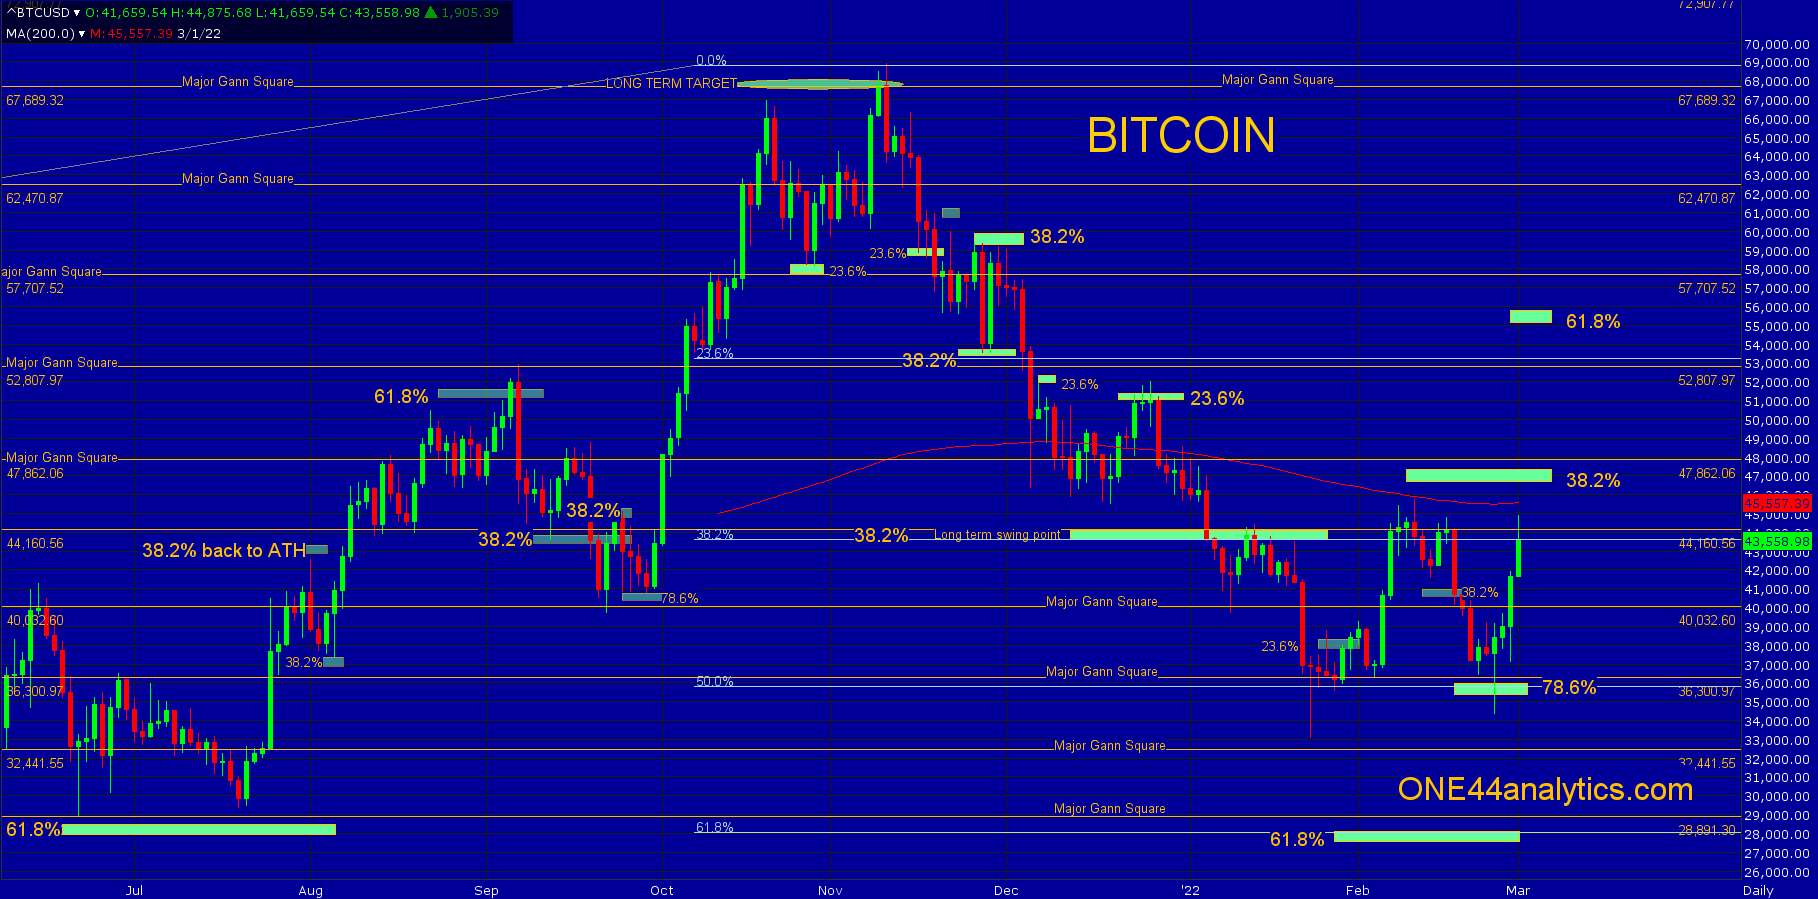
Bitcoin
Starting with this line from the last post…
"A break from 38.2% should send it to new lows for the move, it already failed to hold 38.2% of the rally at 41,000 and there is one area to watch for a bottom if they fail to make a new low and that is 78.6% at 36,050. Following the ONE44 Fibonacci rules, not making a new low after coming off of 38.2% should send it to 61.8% the other way."
It did trade below 78.6% at 36,050, but as always it is the close that matters, so the long term target on a rally from there should send it to 61.8% at 55,250. You will still have to watch 38.2% at 46,750. It fell just short of it on the last rally and could rip right through it on this one, however, if you get a trade up to it, or above it and close below the 200 day average at 45,560 it could send it right back to the lows and the long term target of 28,000.
Now that it has had a sharp rally we can start to watch the retracements below. Most important to this leg up is 38.2% at 40,870, as long as any setback holds this the trend remains positive. This also is the same when and if it hits 46,750 and the new 38.2% level. Only being able to retrace 23.6% at 42,420 keeps this leg up extremely positive. When the 2/10/22 high is taken out, you can then run the retracements back to the low on 1/24/22.
Other levels for resistance are the next two major Gann squares at 47,862 and 52, 807.
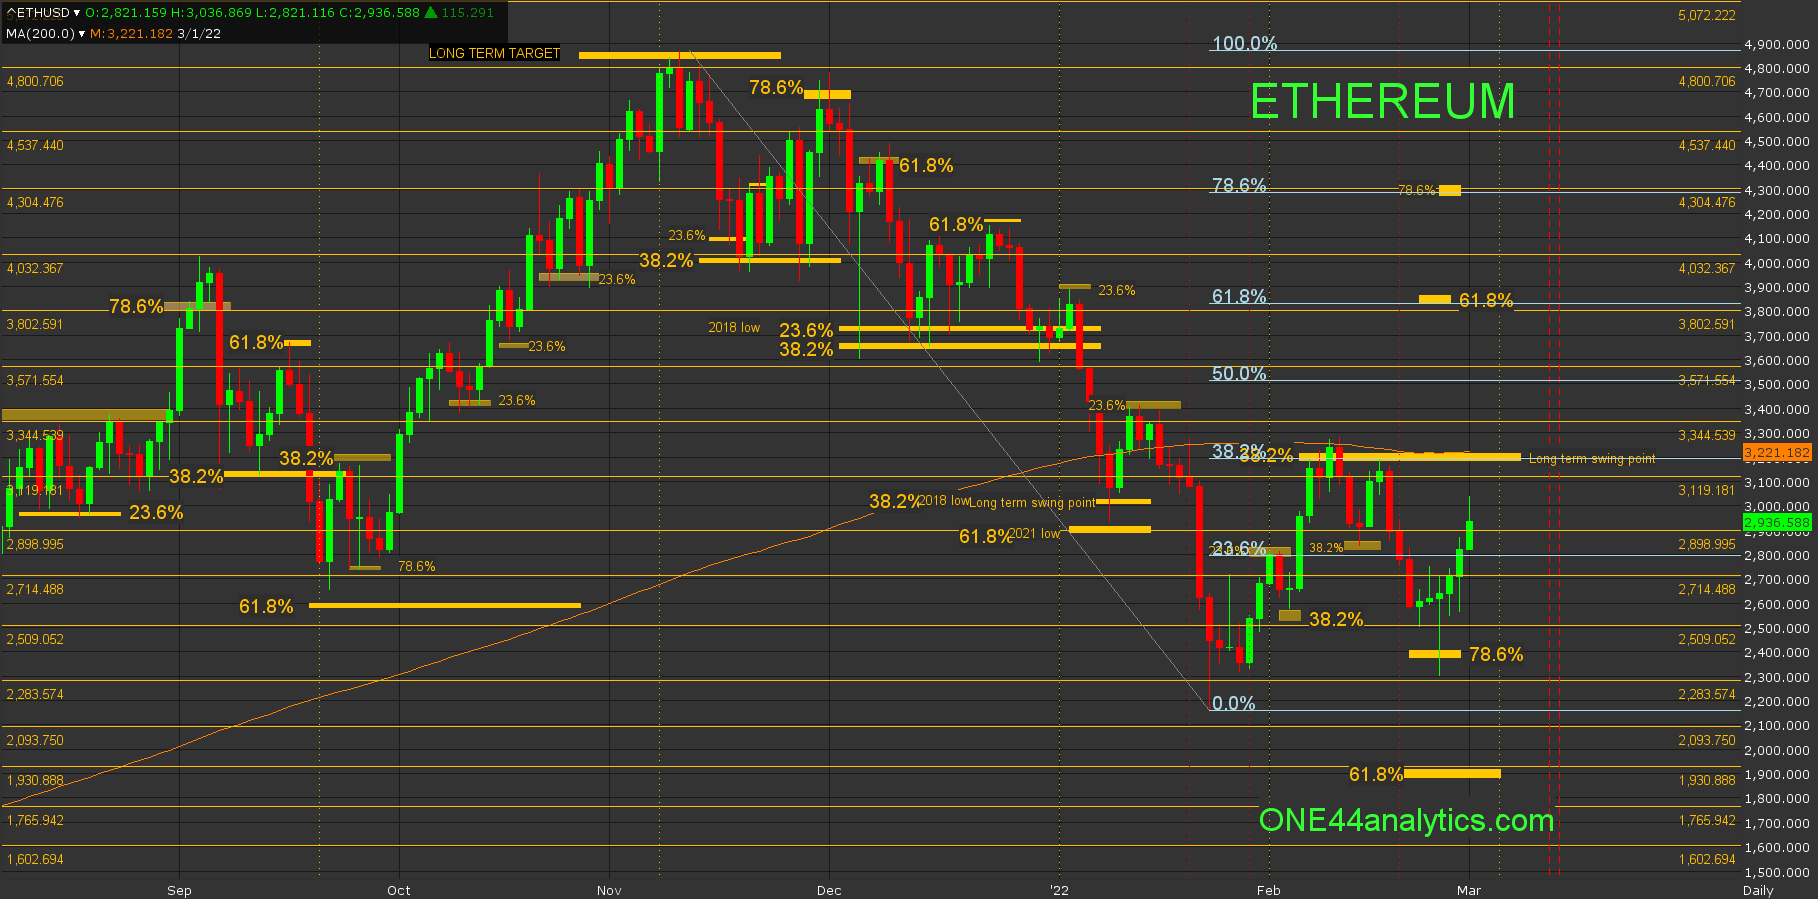
Ethereum
Ethereum also traded down through 78.6% at 2400.00 then closed above it and since the break that took it to this low was from 38.2% above, the next rally, like Bitcoin should also go to 61.8% at 3835.00.
Here too you have to watch the 38.2% level again at 3190.00. This is the long term swing point and the 200 day average is just above it at 3221.00, hitting it or trading above it and closing below the 3119.00 major Gann square can send it to the lows again and the long term target of 1950.00. .
The key level below to keep this leg positive is 38.2% at 2763.00 and any setback that can only get to 23.6% at 2871.00 keeps the short term trend very positive.
Other levels to watch for resistance on a continued rally are the major Gann squares at 3344.00, 3571.00 and 3802.00.
Sign up for our Free newsletter here.
FULL RISK DISCLOSURE: Futures trading contains substantial risk and is not for every investor. An investor could potentially lose all or more than the initial investment. Commission Rule 4.41(b)(1)(I) hypothetical or simulated performance results have certain inherent limitations. Unlike an actual performance record, simulated results do not represent actual trading. Also, since the trades have not actually been executed, the results may have under- or over-compensated for the impact, if any, of certain market factors, such as lack of liquidity. Simulated trading programs in general are also subject to the fact that they are designed with the benefit of hindsight. No representation is being made that any account will or is likely to achieve profits or losses similar to those shown. Past performance is not necessarily indicative of future results.