Bitcoin Ethereum long term levels
ONE44 Analytics where the analysis is concise and to the point
Our goal is to not only give you actionable information, but to help you understand why we think this is happening based on pure price analysis with Fibonacci retracements and Gann squares.
You can get all the rules and guidelines to the Fibonacci retracements on our website.
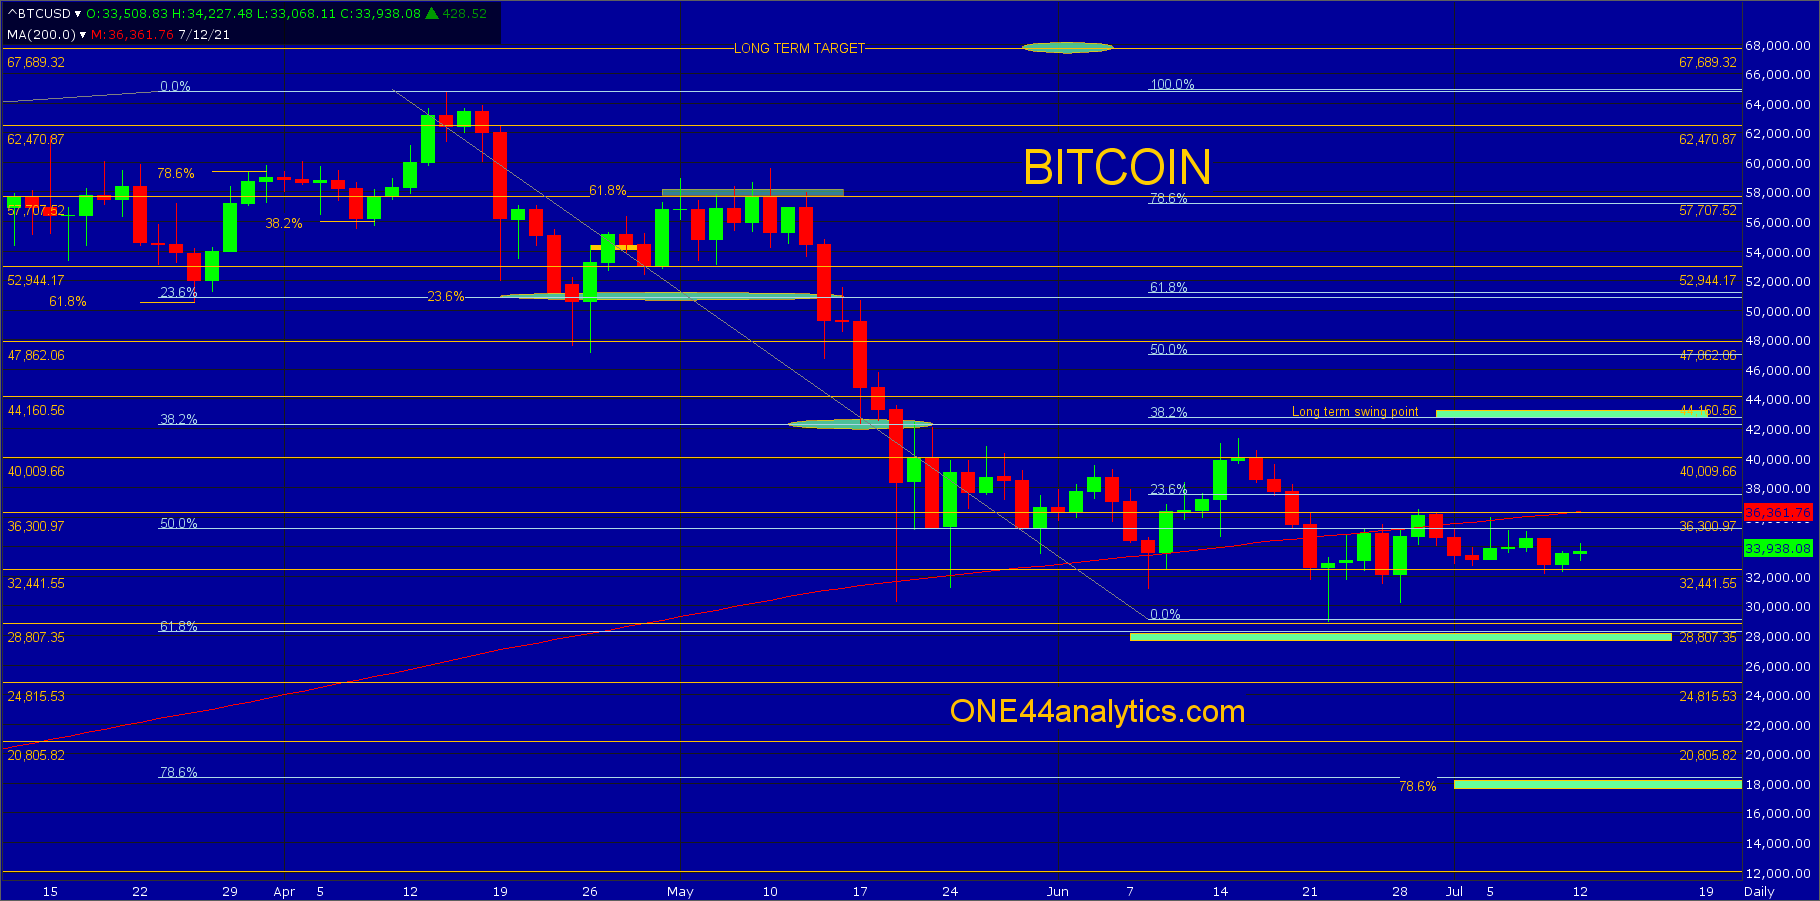
Bitcoin
Bitcoin continues to trade between two major Fibonacci levels. Below is 61.8% of the ATH and the 2018 low, this is 28,300, above is 37,400, this is 23.6% back to the ATH. They have had only one close above the 200 day average since closing below it on 6/21/21, it is currently at 36,360.
Being that the 28,950 low was close to 61.8%, the expected long term target on a rally from this area based on the ONE Fibonacci rules and guidelines is 61.8% back to the ATH, this is 51,200.
As always we watch all the retracements on any move to see just how strong, or weak the market is. Our long term swing point is 42,800, this is 38.2% back to the ATH and not until this level is taken out, will the long term trend turn positive again. An earlier sign that the trend is turning positive is, when the setbacks on the rallies hold 38.2% of the move.
Until they can close above 37,400 (23.6%) a new low is still possible. On a retest of the current low, look for 30,600, this is 78.6% and it is often where a lot of bull runs start and end. With a solid close below 28,300 (61.8%) look for 18,500, this is 78.6% of the ATH and the 2018 low.
In between these long term Fibonacci levels you can use the major Gann squares for support and resistance as well. These are marked by the yellow horizontal lines on the chart below.
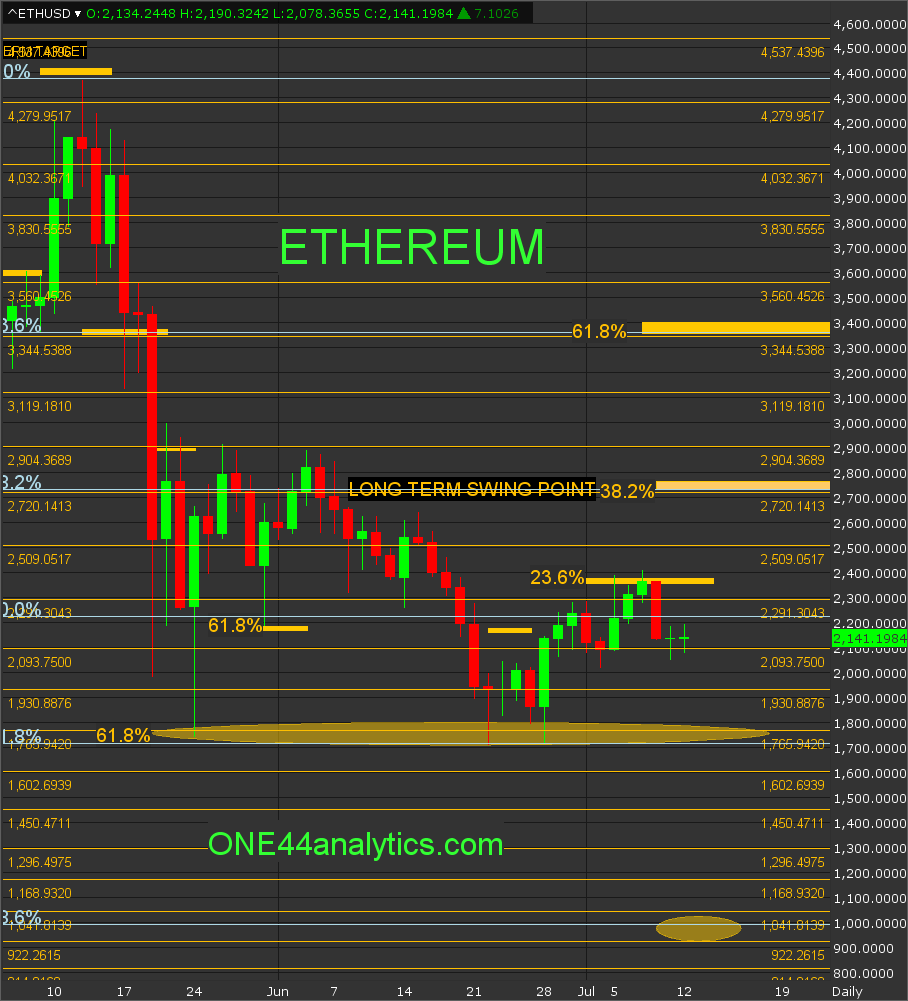
Ethereum
Ethereum is also caught between two major retracements, one being 61.8% of the ATH and the 2018 low and the other is 23.6% back to the ATH. These levels are 1720.00 and 2350.00.
The long term swing point is 2740.00, this is 38.2% back to the ATH. The long term target on a rally from 1720.00 can take it up to 61.8% the other way at 3350.00. Until it can take out 2350.00 a new low is possible. On a retest of the current low look for 78.6% at 1870.00, as mentioned in the Bitcoin update, this is where a lot of new bull runs start from.
With a new low, look for 1045.00, this is 78.6% of the ATH and the 2018 low.