Bitcoin/Ethereum long term swing points
ONE44 Analytics where the analysis is concise and to the point
Our goal is to not only give you actionable information, but to help you understand why we think this is happening based on pure price analysis with Fibonacci retracements and Gann squares.
You can get all the rules and guidelines to the Fibonacci retracements on our website.
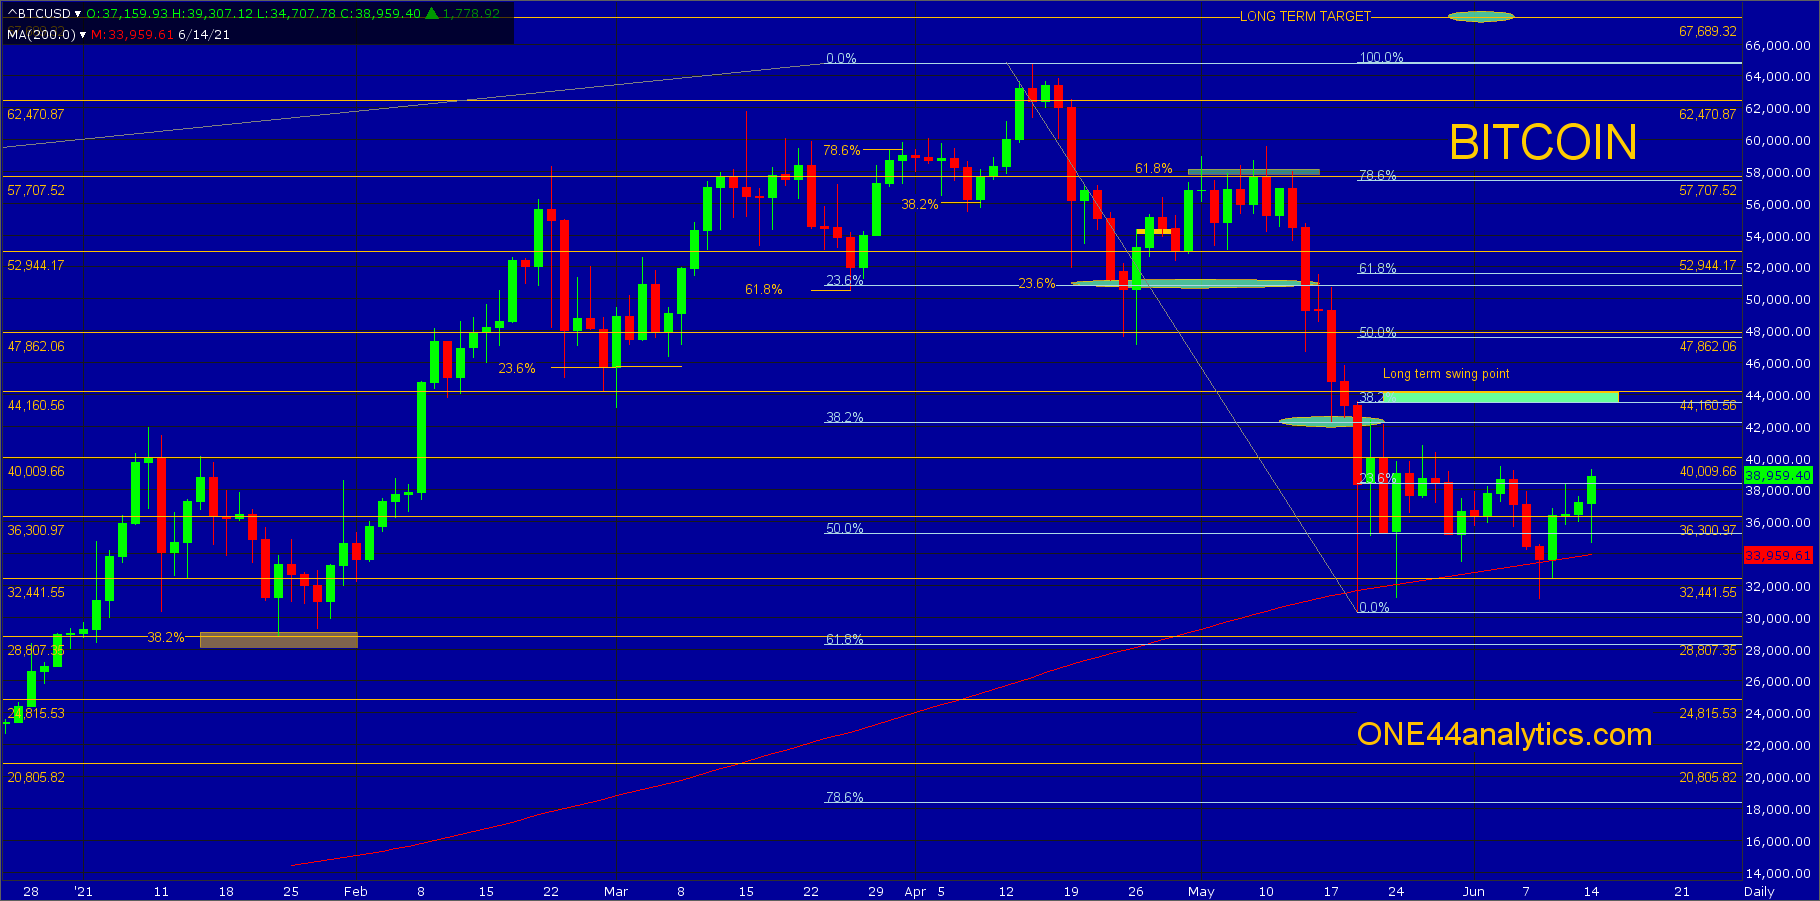
Bitcoin
The long term trend turned negative on 5/19/21 when it took out 38.2% of the ATH and the 2018 low, this was 42,500. The trade since then has been sideways with a few bounces off of the 200 day moving average, currently 33,960. The new long term swing point is 43,500, this is 38.2% back to the ATH. Until this level is taken out they can still go for new lows and 61.8% back to the 2018 low, this is 28,300. With the rally this weekend you can retrace back to low on 6/8/21 and use 38.2% of that move as a tight swing point, this is 36,300, it is also a major Gann square. Provided any setback only goes this far, look for a rally up to the long term swing point.
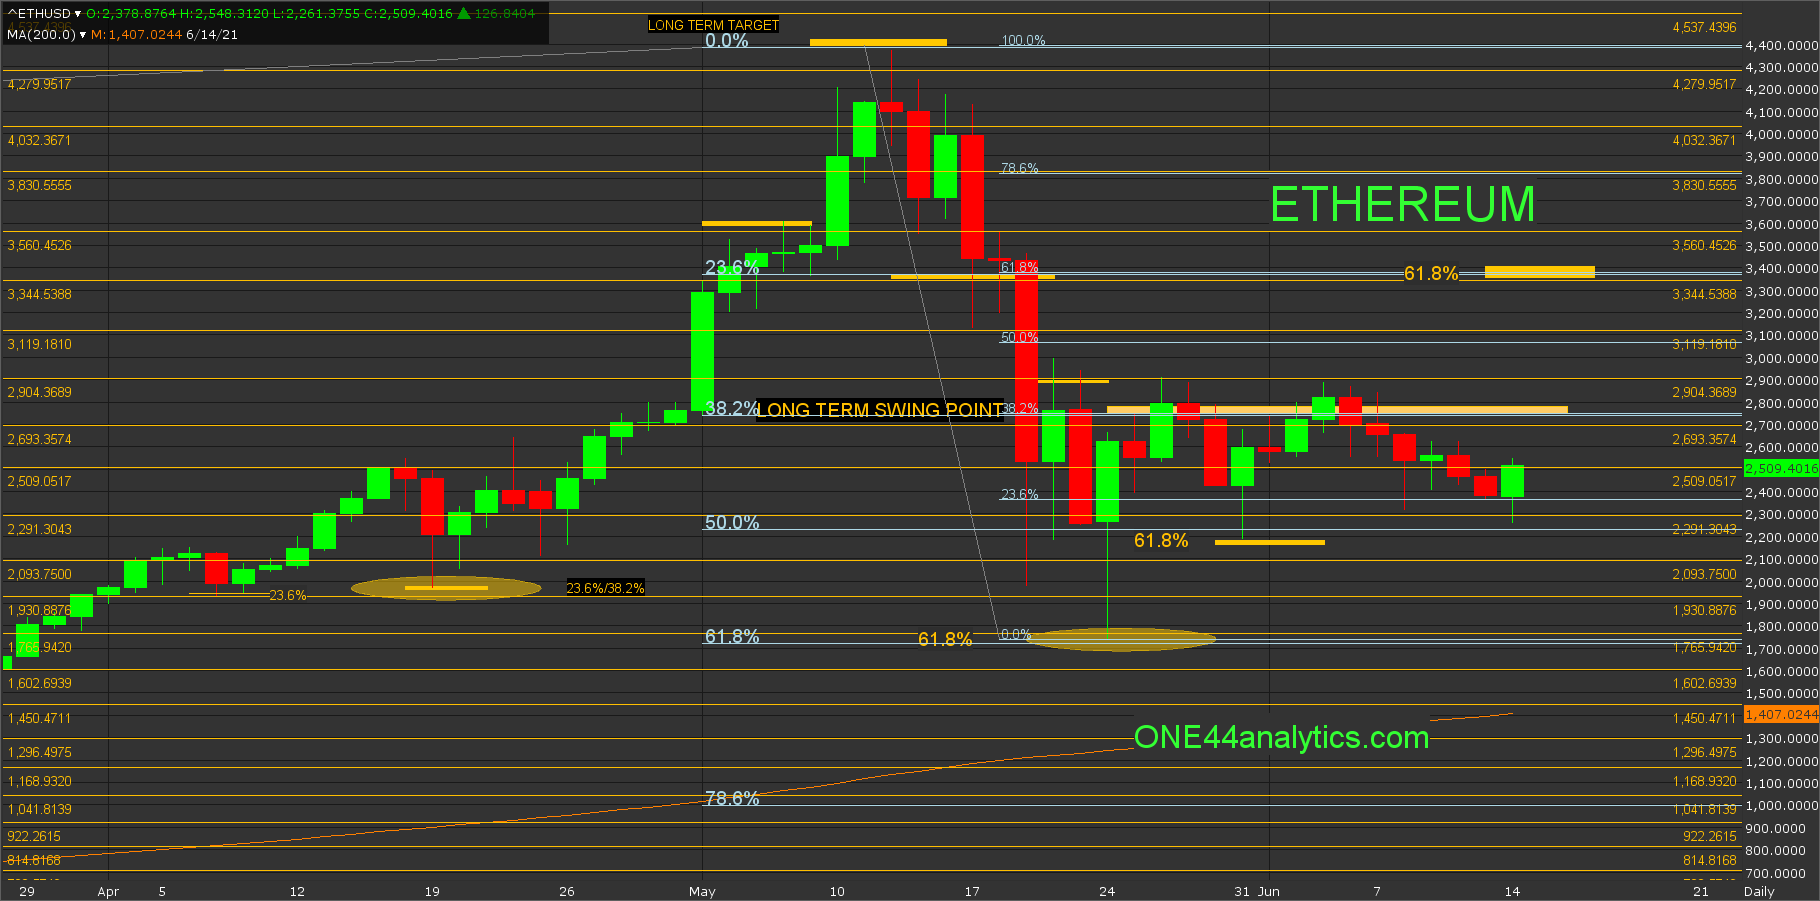
Ethereum
The long term trend also turn negative on May 19th. The break below it hit 61.8% of the ATH and the 2018 low, this was 1745.00. The rallies so far have hit the 2741.00 long term swing point on two different attempts. the first setback hit 61.8% back to the 19th low and the second one held above it. Until they can get above 2741.00 a new low is possible and even down to 78.6% at 1008.00. Once they clear 2741.00 the break should be over and you can look for 61.8% at 3375.00.