Bitcoin, Litecoin Top?
ONE44 Analytics where the analysis is concise and to the point
Our goal is to not only give you actionable information, but to help you understand why we think this is happening based on pure price analysis with Fibonacci retracements, that we believe are the underlying structure of all markets and Gann squares.
Here is a quick set of guidelines for the Fibonacci retracements to help with this article. You can find all the rules/guidelines and examples on any deviations from these four basic rules on our website.
1) The Golden rule, any market that is going to continue the current trend must hold 38.2% and a new high/low should follow.
2) Markets that are extremely strong/weak will only go 23.6% and a new high/low should follow. Typically a runaway market.
3) The 61.8% rule is, any market that holds 61.8% should go 61.8% of where it just came from. Usual happens when a market is directionless, or in a consolidation period.
4) The 78.6% rule is, any market that holds 78.6% should go 78.6% of where it just came from. This is also where a lot of Bull markets end and start.
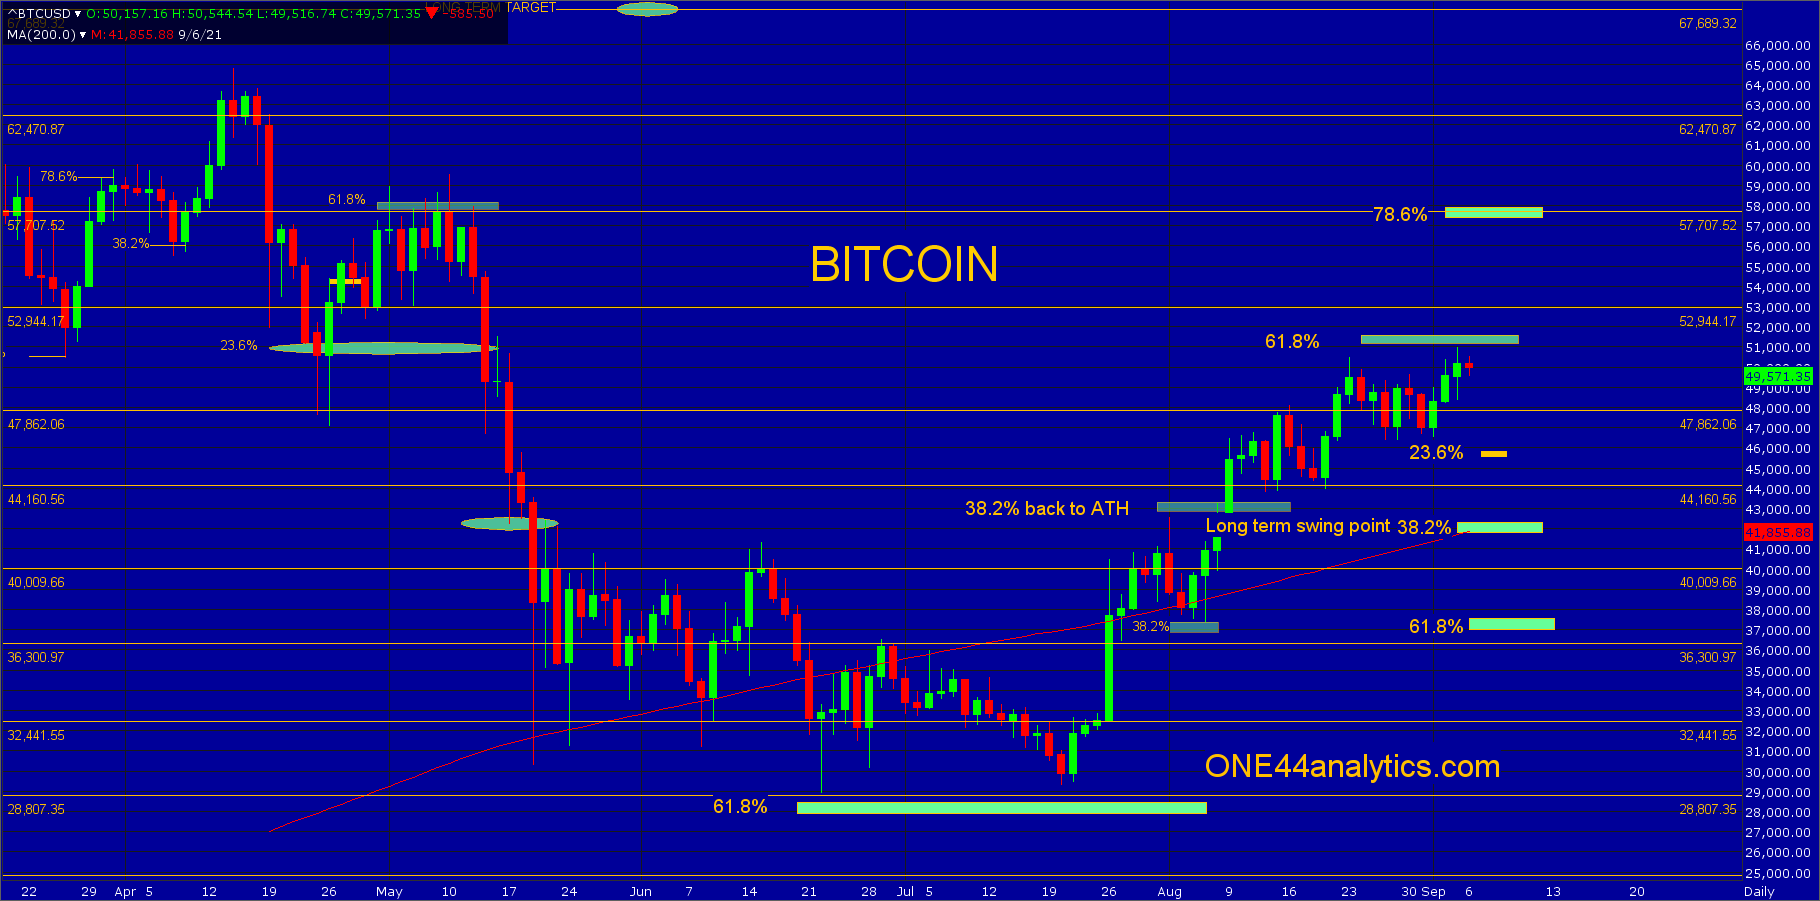
Bitcoin
We think there is a very good chance of the current high being a top for now. This is based on the same reason we gave the long term targets of 51,150 back on June 22nd. You can see this post here. The low in June was just shy of 61.8% of the ATH and the 2018 low, being that this was 61.8%, the target on a rally from this area would be 61.8% (51,150) the other way, per the rule above.
With a top in this area the long term target will be 61.8% of the current rally at 37,500. As we always say, we will watch all the retracements on any move to see just how weak, or strong the market is. The long term swing point to keep the current trend positive is 38.2% at 42,400 and any setback that can't get below 23.6% at 45,850 keeps the trend extremely positive.
A solid close above 51,150 will make this level the short term swing point and the next target will be 78.6% at 57,400, there is also a major Gann square at 57,700.
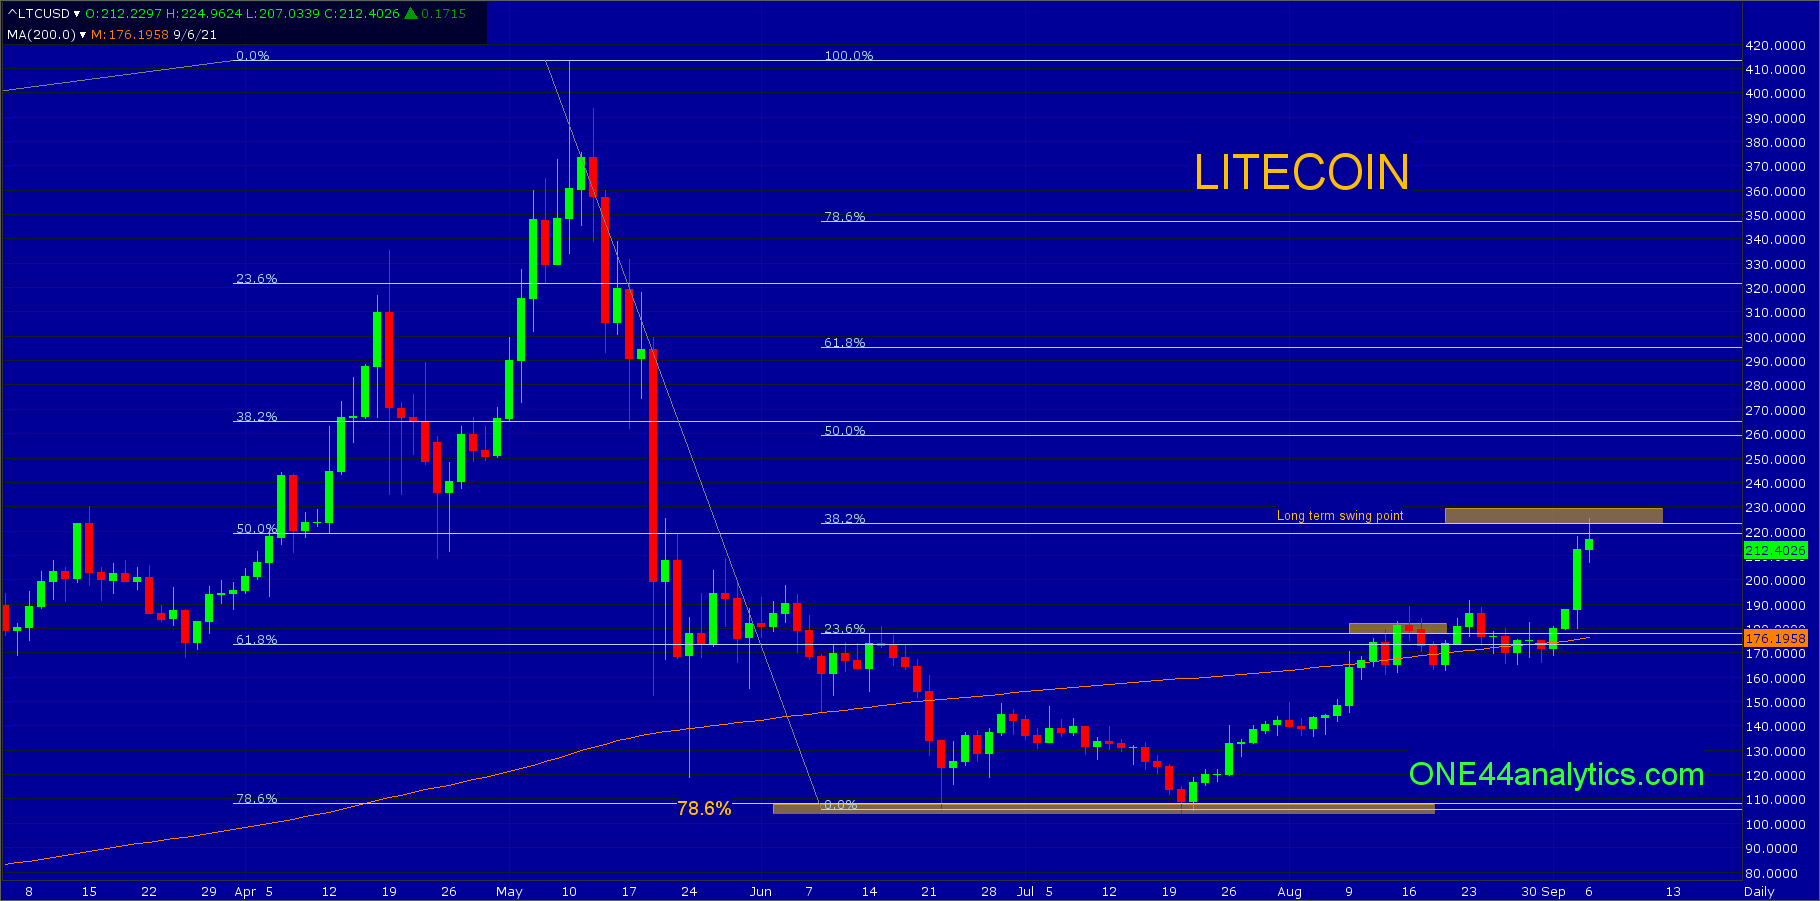
Litecoin
Following the same ONE44 Fibonacci rules and guidelines you can see on the chart below that the low in June held 78.6% of the ATH and 2018 low, this was 109.00, it hit there again on 720/21. The long term target on a rally from there is 78.6% the other way and this is 350.00, however watching all the retracements Friday's high was 38.2% back to the ATH, this is 223.00. Following the 38.2% rule the trend will remain down until this level can be taken out and a break from here can send it to new lows, or at least a good test of it. We will be watching all the retracements on any setback to see just how weak, or strong the market is. With a solid close above 223.00 look for 61.8% at 295.00.
All of our posts on the website and YouTube videos are done in the same fashion of educational and actionable information. You can also find our short term updates in Cryptocurrencies on the hourly charts. Whatever technical analysis tool you are using should work the same in all markets and time frames to truly be of use and we show this in the short and long term updates.
Sign up for our Free newsletter here.
FULL RISK DISCLOSURE: Futures trading contains substantial risk and is not for every investor. An investor could potentially lose all or more than the initial investment. Commission Rule 4.41(b)(1)(I) hypothetical or simulated performance results have certain inherent limitations. Unlike an actual performance record, simulated results do not represent actual trading. Also, since the trades have not actually been executed, the results may have under- or over-compensated for the impact, if any, of certain market factors, such as lack of liquidity. Simulated trading programs in general are also subject to the fact that they are designed with the benefit of hindsight. No representation is being made that any account will or is likely to achieve profits or losses similar to those shown. Past performance is not necessarily indicative of future results.