Bitcoin new ATH and just short of our Long Term Target
ONE44 Analytics where the analysis is concise and to the point
Our goal is to not only give you actionable information, but to help you understand why we think this is happening based on pure price analysis with Fibonacci retracements, that we believe are the underlying structure of all markets and Gann squares.
For the ONE44 Fibonacci rules and guidelines to help with this article, go here.
Charts are courtesy of Barchart.com
In previous updates on the Cryptocurrencies we have shown you how to find support and resistance when using Fibonacci retracements and what to look for when it reacts from one of the levels based on the ONE44 guidelines. In this article we will go over support and resistance when using the W.D. Gann Law of Vibration charts.
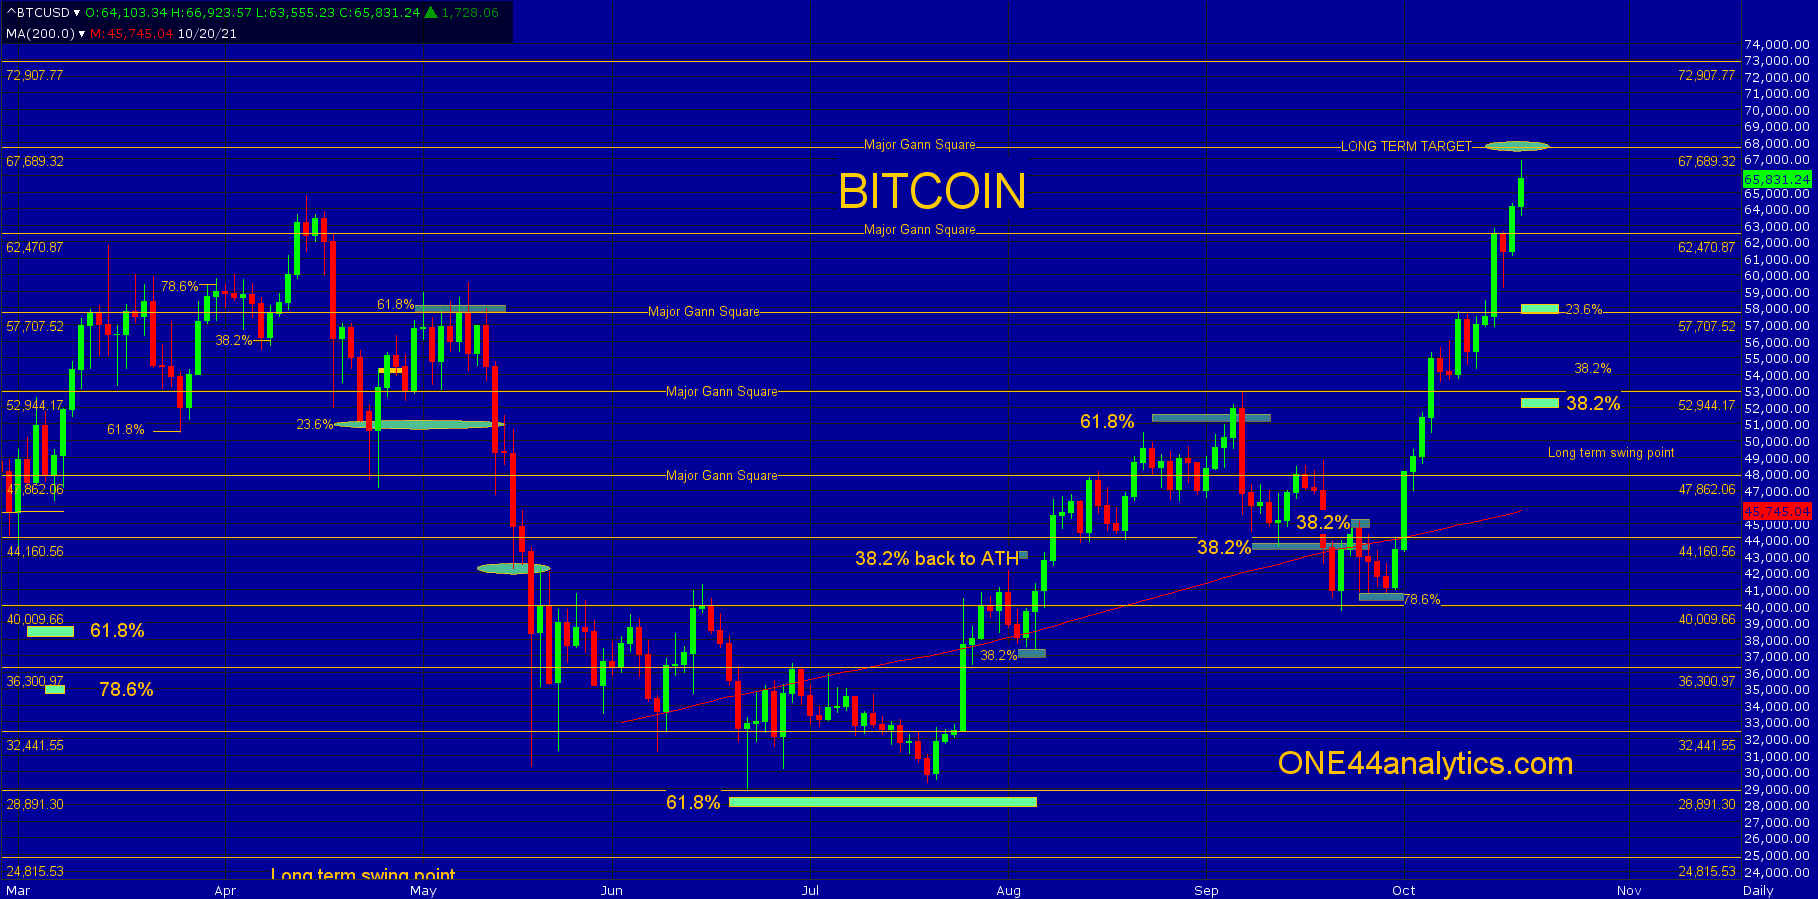
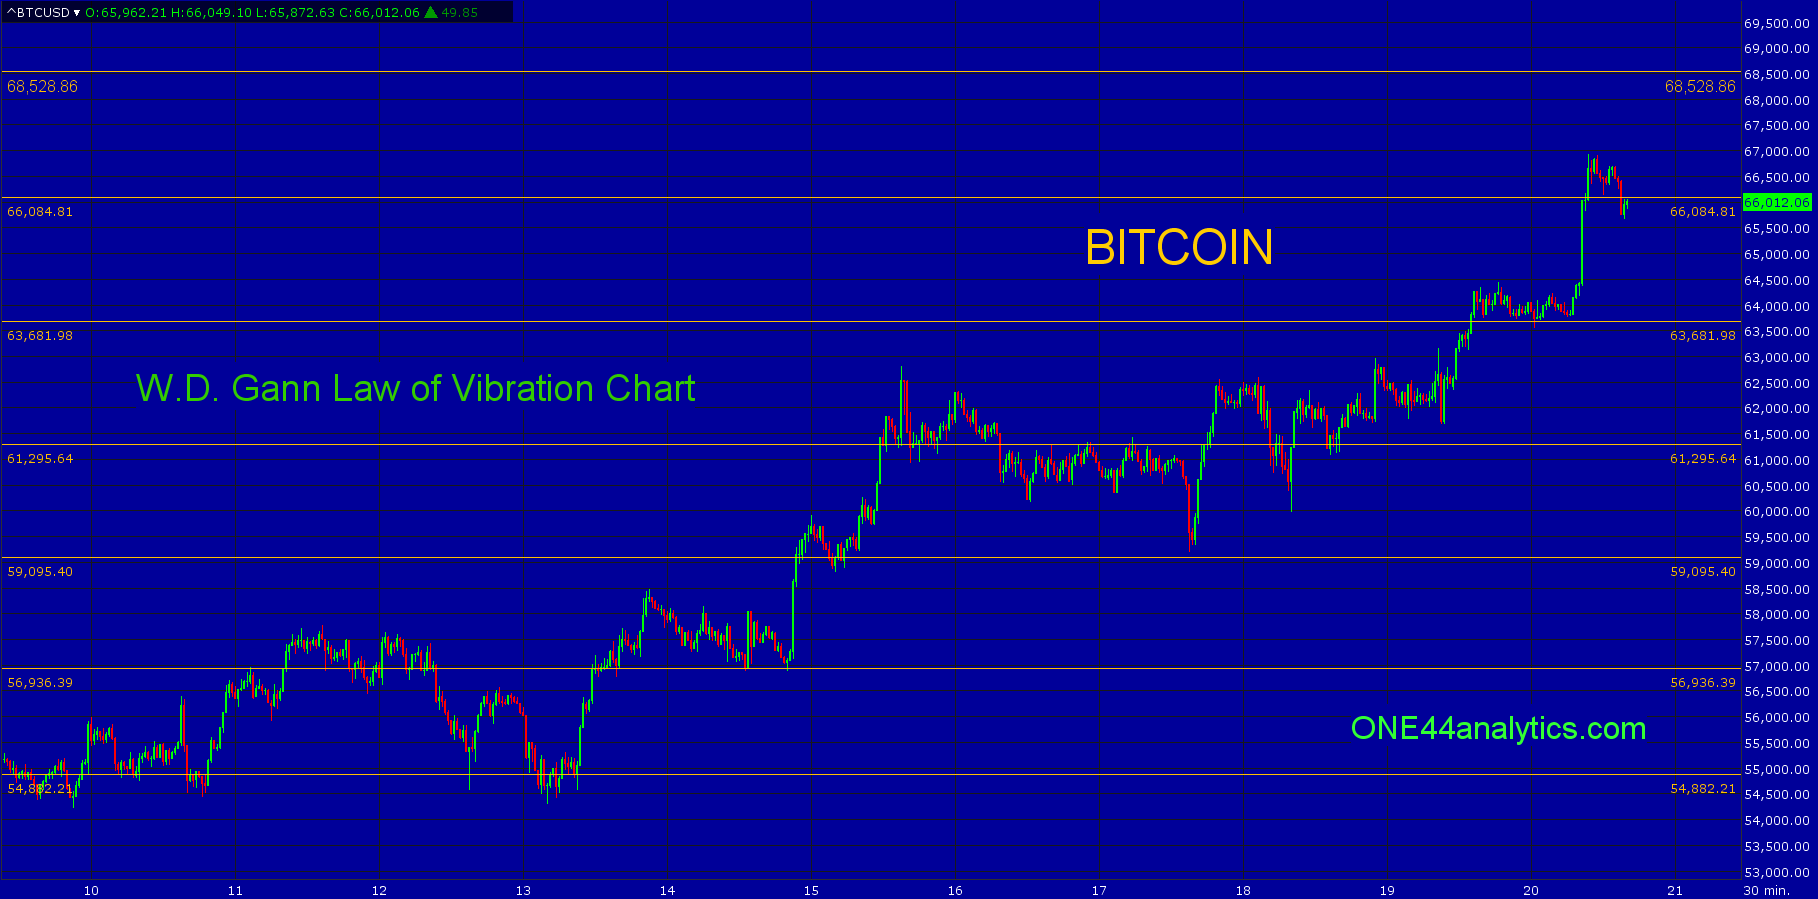
There are major Gann squares that are put on our Daily chart and secondary Gann squares on the hourly chart, they are marked by the yellow horizontal lines.
Each of these price levels are both support and then resistance when the market has taken it out and the reverse is true when it starts as resistance. Once you have exceeded a support/resistance level the target becomes the next square, in essence they are static swing points. Take a good look at all of the highs and lows that have come at these points on the Daily chart below, seeing is believing. We like to use these levels in conjunction with the Fibonacci retracements to get a better understanding of the trend and potential on bigger moves.
Bitcoin
Right now our long term target has been the 67,689 major Gann square. You can use the 62,470 Major Gann square as a short term swing point since they have now closed above it. When and if it closes above 67,689, it will become the new short term swing point and we will have a new, much higher long term target that you will be able to get in coming updates. Also watch the major Gann squares below that line up with the Fibonacci retracements to find even more important swing points. You can also use the Hourly chart for tighter support/resistance with the Gann squares. (Second Chart )
You can get updated short term Law of Vibration charts each day for Bitcoin, Ethereum, Cardano, Litecoin, Ripple and Dogecoin HERE
Sign up for our Free newsletter here.
FULL RISK DISCLOSURE: Futures trading contains substantial risk and is not for every investor. An investor could potentially lose all or more than the initial investment. Commission Rule 4.41(b)(1)(I) hypothetical or simulated performance results have certain inherent limitations. Unlike an actual performance record, simulated results do not represent actual trading. Also, since the trades have not actually been executed, the results may have under- or over-compensated for the impact, if any, of certain market factors, such as lack of liquidity. Simulated trading programs in general are also subject to the fact that they are designed with the benefit of hindsight. No representation is being made that any account will or is likely to achieve profits or losses similar to those shown. Past performance is not necessarily indicative of future results.