Cryptocurrencies

BTCUSD daily support and resistance
The Charts below are natural support and resistance levels that are based on W.D. Gann "Law of Vibration".
There are also charts that have the Fibonacci retracements on them for support/resistance and to determine the trend, short and long term.
1/1/25
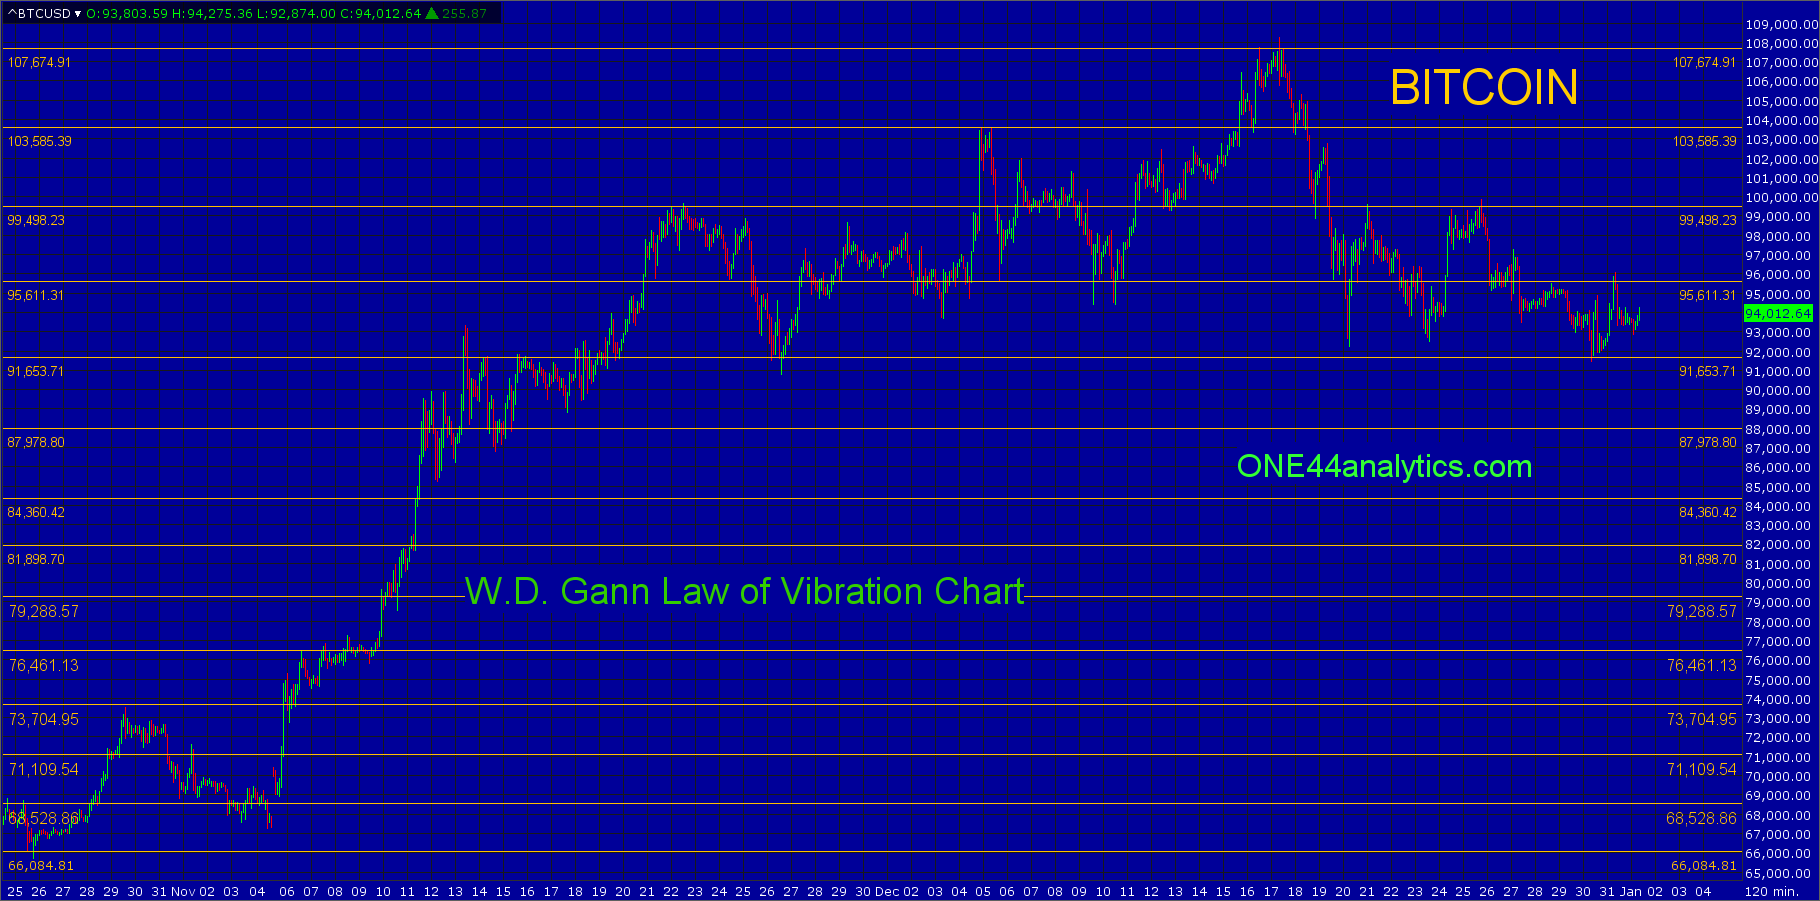
Bitcoin
From last week,
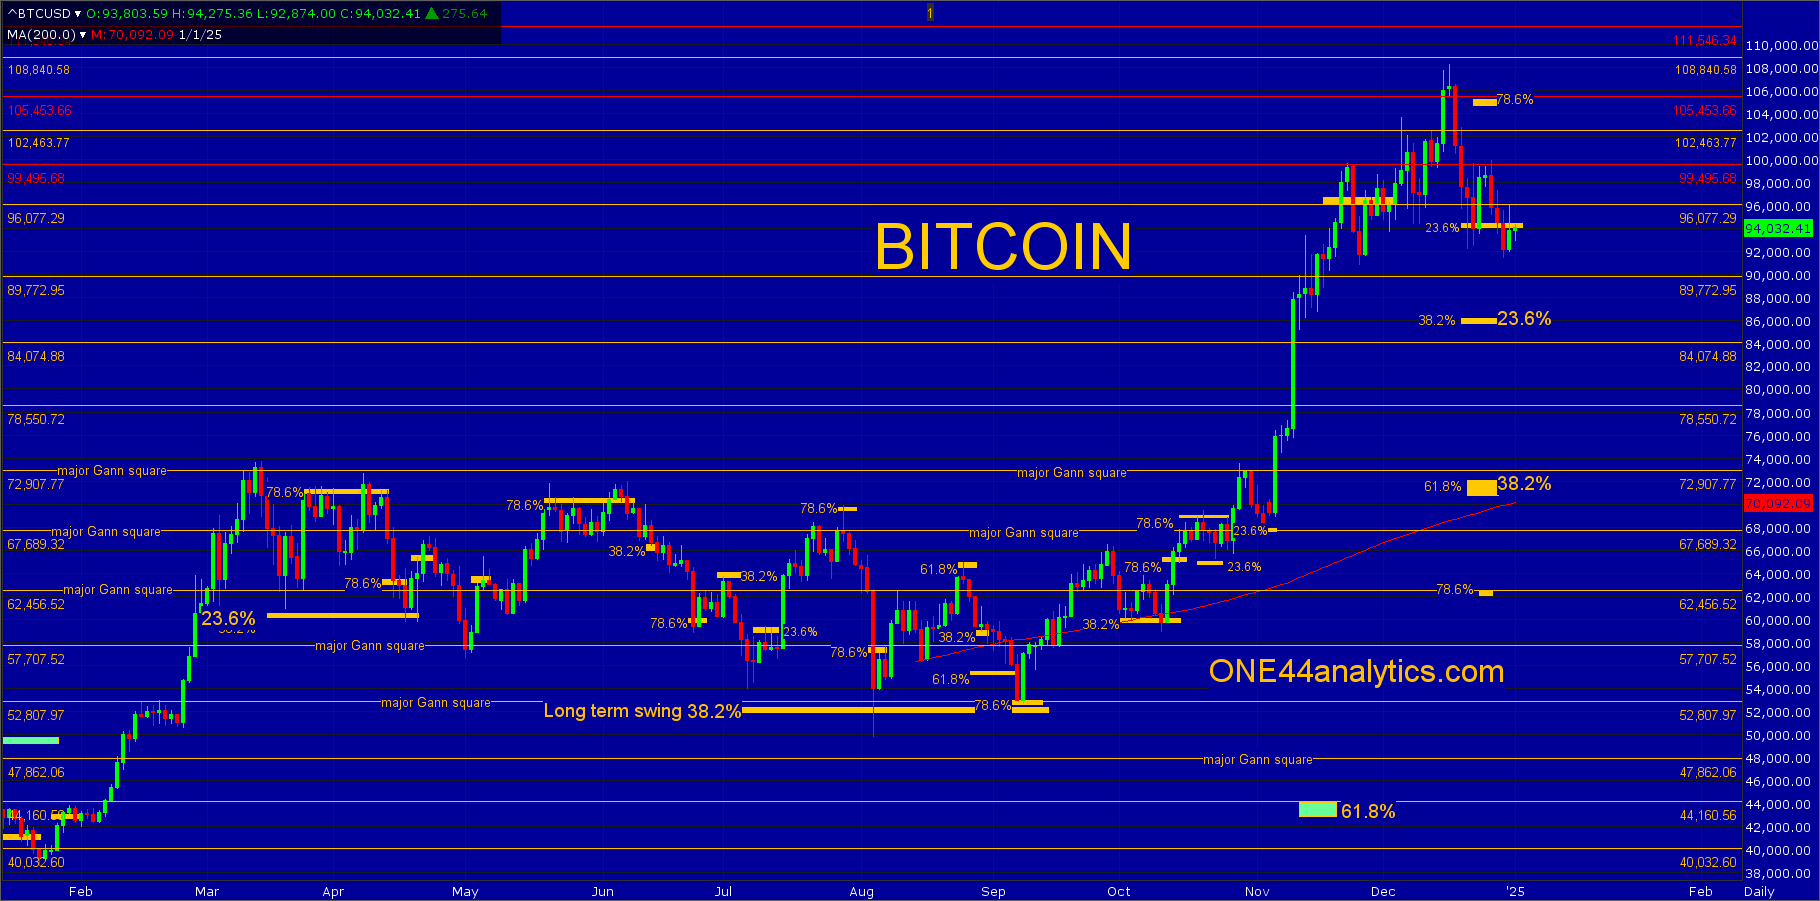
The rally to start the week fell short of the 108,840 major Gann square, however with the new ATH moved the 23.6% level going back to the 8/5/24 low up to 94,500, it traded below it, but didn't close below it so it will be the key level for the next week.
Use 94,500 as the swing point for the week.
The rally this week could only get up to the 99,450 major Gann square and with no new low all the levels remain the same for the next week.
Use 94,500 as the swing point for the week again.
Above it, look for 78.6% back to the ATH at 104,650, on an extended move higher, there are only major Gann squares to look for resistance and then use as the swing point when closed above, the next two are 108,840 and 115,797.
Below it, the retracements from the 2022 low and 8/5/24 low match up at the same price, but different retracements, The next key support is 23.6% back to the 2022 and 38.2% back to 8/5/24 at 86,230. The long term swing point is at 72,100, this is 38.2% back to the 2022 low and 61.8% back to the 8/5/24 low.