Chaotic Bitcoin, Ethereum moves explained with Fibonacci
ONE44 Analytics where the analysis is concise and to the point
Our goal is to not only give you actionable information, but to help you understand why we think this is happening based on pure price analysis with Fibonacci retracements, that we believe are the underlying structure of all markets and Gann squares.
For the ONE44 Fibonacci rules and guidelines to help with this article, go here.
Charts are courtesy of Barchart.com
This is our latest video in an ongoing series of how to use the Fibonacci retracements. Even if you do not trade the market covered, the ONE44 rules and guidelines are the same, as we believe the Fibonacci retracements are the underlying structure of all markets.
https://youtu.be/HEyLVbjvHDg
Cryptocurrencies
All of these charts and levels have been posted well ahead of time on our FREE blog.
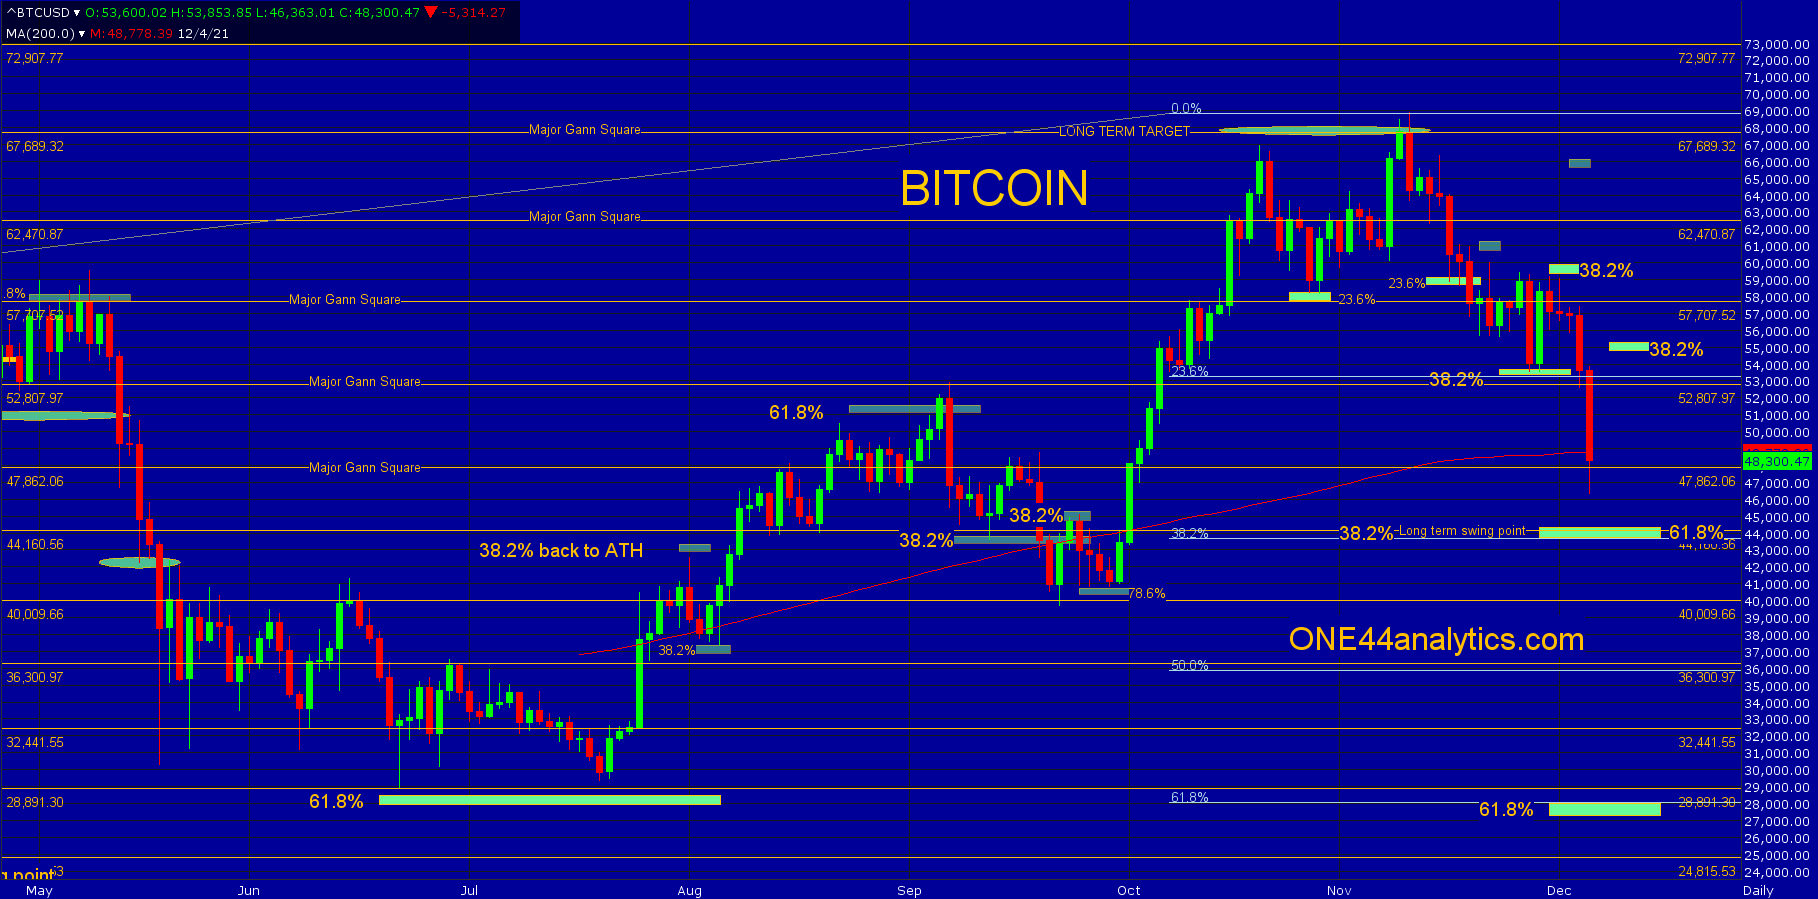
Bitcoin
After hitting the long term target and major Gann square at 67,689, the first break took it to 38.2% (53,700) of the June low. A rally from 38.2% should send it to new highs, however it could only go 38.2% (59,400) back to the ATH. This is never a good sign to be rejected at 38.2% of a smaller move after hitting such a big retracement below and new lows followed. The overnight move blew through 53,700 and below the 200 day average at 48,800. Any time you take out 38.2% (53,700) the target becomes 61.8% of the same move and this is 44,400. This is also a major Gann square and just below it at 43,700 is 38.2% back to the 2018 low and this is the long term swing point. Until it can reach this point, watch 54,700 to see if the short term trend can turn positive, this is 38.2% back to the ATH. Any rally that fails to get above 23.6% at 51,500 keeps the short term trend very negative.
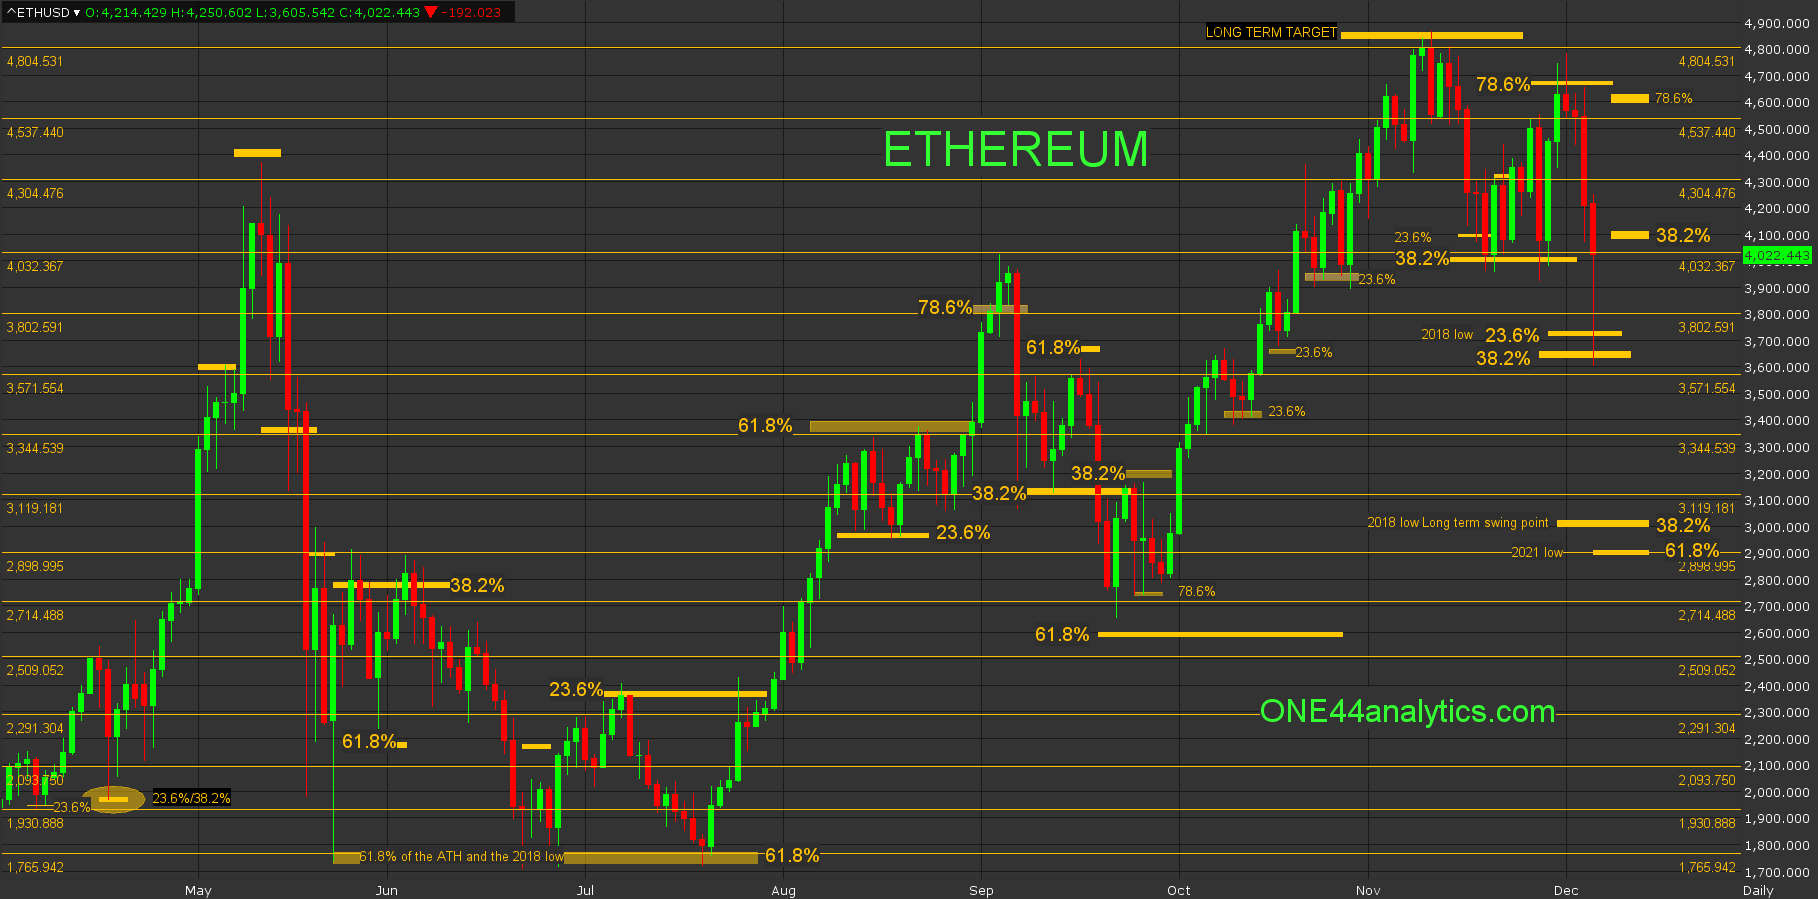
Ethereum
The high on 11/10/21 also hit our long term target at 4840.00 and the first break held the area of 4090.00 to 4010.00, this was first 23.6% back to the June low and secondly 38.2% back to the 9/22/21 low. The rally from it hit the 4537.00 major Gann square before returning to that key area. The second rally from it took it to 78.6% back to the ATH. It did trade above it, but never closed above it and this is key. As I have said before this is where a lot of Bull runs end and also start. The break from there went right to the next set of major retracements between 3740.00 and 3650.00. The first one is 23.6% back to the 2018 low and the second one is 38.2% back to the June low. It has already had a big bounce from this area, currently at 4031.00. A rally from here should send it to new highs, however we have to watch 38.2% back up at 4085.00, if they can take this level out the short term trend turns positive and you can look for 78.6% of the same move at 4600.00, if not look for new lows and the long term swing point down at 3022.00.
Sign up for our Free newsletter here.
FULL RISK DISCLOSURE: Futures trading contains substantial risk and is not for every investor. An investor could potentially lose all or more than the initial investment. Commission Rule 4.41(b)(1)(I) hypothetical or simulated performance results have certain inherent limitations. Unlike an actual performance record, simulated results do not represent actual trading. Also, since the trades have not actually been executed, the results may have under- or over-compensated for the impact, if any, of certain market factors, such as lack of liquidity. Simulated trading programs in general are also subject to the fact that they are designed with the benefit of hindsight. No representation is being made that any account will or is likely to achieve profits or losses similar to those shown. Past performance is not necessarily indicative of future results.