Coffee and its underlying structure
ONE44 Analytics where the analysis is concise and to the point
Our goal is to not only give you actionable information, but to help you understand why we think this is happening based on pure price analysis with Fibonacci retracements, that we believe are the underlying structure of all markets and Gann squares.
For the ONE44 Fibonacci rules and guidelines to help with this article, go here.
Charts are courtesy of Barchart.com
COFFEE
We do not usually cover coffee, however I wanted to show you how the Fibonacci retracements work in every market. As we believe, "They are the underlying structure of all markets".
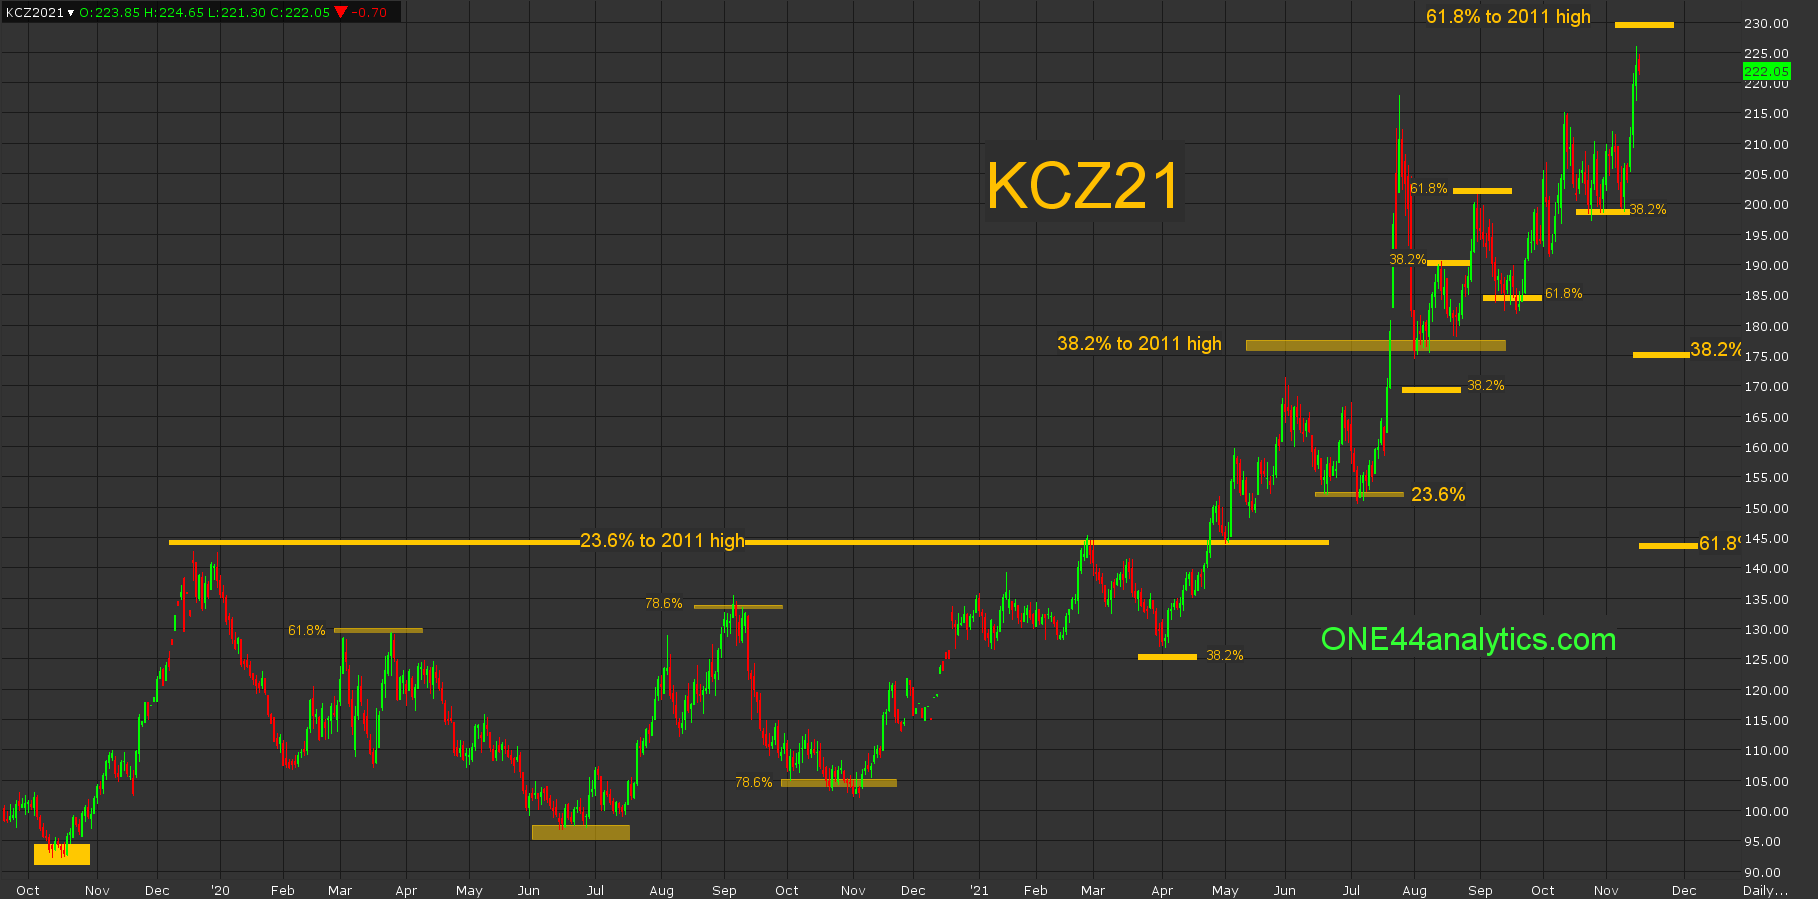
Starting with the low made in October of 2019, the first rally took it to 23.6% back to the 2011 high on 12/31/19. The target based on the "23.6% rule" should be for new lows to keep the trend negative and a failure to make a new low should send it to 38.2% of the same move, this would be 176.00. A lot happened before that target was reached and a lot of time passed, but the target remained.
In between failing to make the new low in June 2020 from 23.6% and the 38.2% target, there were a few other things playing out. First was the rally from the June 2020 low took it to 78.6% at 134.00 on 9/4/20. The target after hitting 78.6% should be to look for a break to 78.6% of where it just came from and this was 105.25, it was hit on 10/5/20. We also know from the "78.6% rule" that this is where a lot of Bull runs start and end. In this case it is where the next one started.
The setback from 23.6% of the 2011 high, hit again on 2/25/21 took it to 38.2% of the October 2019 low, this was 127.50 hit on 4/1/21. By holding 38.2% it now tells us there is an established trend and we should look for new highs for the move. The rally from there fell short of the longer term target of 38.2% back to the 2011 high on 6/2/21, however the setback from that high held 23.6% and this tells us we have an extremely strong market based on the "23.6% rule". The explosive move higher from there took it from 151.50 to 217.85 in 13 trading days. The setback from the high on 7/26/21 could not get back to 38.2% of the move, keeping the trend positive.
In between the low on 8/2/21 and where they are now, there were more short term retracements playing out. The first rally from that low hit 38.2% on 8/13/21 the target was new lows and a failure to make new lows should send it to 61.8% of the same move. There was no new low and it hit 61.8% of the same move on 8/31/21. The target based on the "61.8% rule" is 61.8% the other way. This target was completed on 9/14/21. The rally from there failed to make a new high, however the setback from it held 38.2% on 10/26/21. This turned the short term trend positive again to match up with the long term trend.
Currently, it is just short of 61.8% back to the 2011 high, this is 229.00 and it is an area to be respected as a break from 61.8% can send it 61.8% the other way and this would be 144.00. As we always say, we watch all the retracements on every move to see just how weak, or strong the market is regardless of the long term target. Any break from here that didn't take out 38.2% at 175.00 keeps the long term trend positive and a break that can only go 23.6% at 196.00 keeps the trend extremely strong. Provided there is no turn lower from the 229.00 area and they get a solid close above it, the next long term target is 78.6% to the 2011 high, this is 265.00.
We have a new video explaining how to use the Fibonacci retracements based on the ONE44 rules and guidelines. Even if you do not trade the markets in it, the rules are the same for ALL markets.
Sign up for our Free newsletter here.
FULL RISK DISCLOSURE: Futures trading contains substantial risk and is not for every investor. An investor could potentially lose all or more than the initial investment. Commission Rule 4.41(b)(1)(I) hypothetical or simulated performance results have certain inherent limitations. Unlike an actual performance record, simulated results do not represent actual trading. Also, since the trades have not actually been executed, the results may have under- or over-compensated for the impact, if any, of certain market factors, such as lack of liquidity. Simulated trading programs in general are also subject to the fact that they are designed with the benefit of hindsight. No representation is being made that any account will or is likely to achieve profits or losses similar to those shown. Past performance is not necessarily indicative of future results.