COIN, not much history, but a lot of Fibonacci
ONE44 Analytics where the analysis is concise and to the point
Our goal is to not only give you actionable information, but to help you understand why we think this is happening based on pure price analysis with Fibonacci retracements, that we believe are the underlying structure of all markets and Gann squares.
For the ONE44 Fibonacci rules and guidelines to help with this article, go here.
Charts are courtesy of Barchart.com
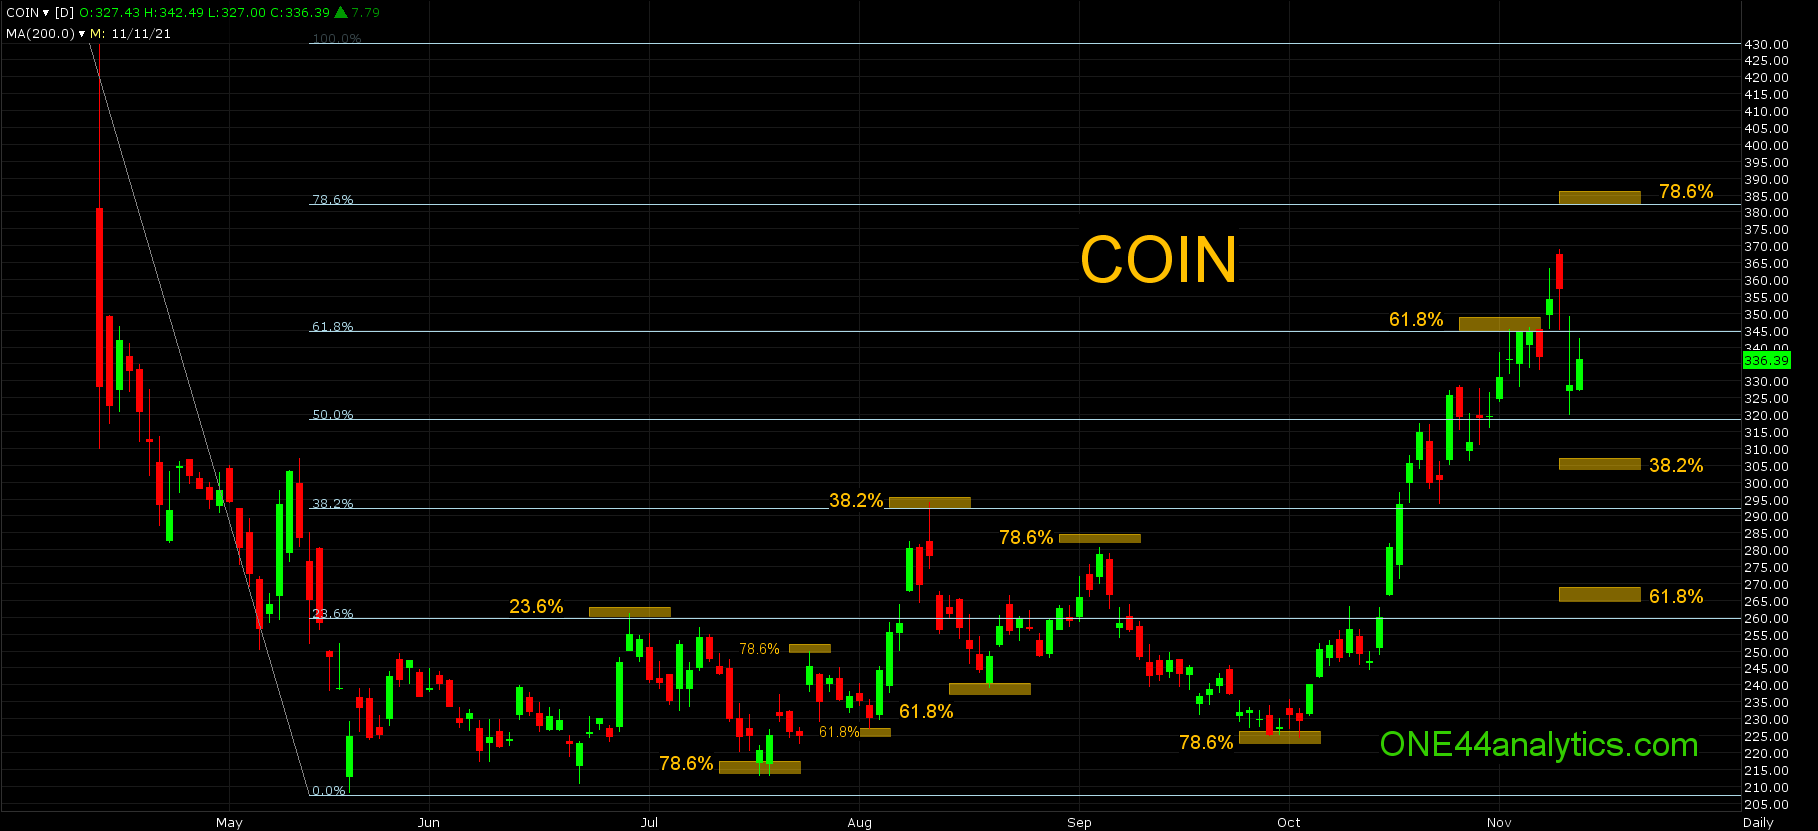
In this example of the ONE44 Fibonacci rules and guidelines we will show you how all the retracements played out and why.
Once the ATH and ATL were established between 4/14/21 and 5/19.21 we can start to use the retracements and the first one to hit was 23.6% back on 6/29/21. Based on the 23.6% rule, we know that extremely weak markets will only retrace 23.6% and it should make a new low to keep the trend negative. A failure to make a new low should send it up to 38.2%. Before we get there let's look at the retracement it hit when it failed to make the new low. The low on 7/19/21 held 78.6%, following the 78.6% rule we know,
Any market that hits 78.6% should go 78.6% back the other way. This is also where a lot of Bull markets end and start.
Five trading days later it hit 78.6% on 7/26/21. The break from there held 61.8% on 8/3/21 before going on to the 38.2% (291.00) target mentioned before on 8/11/21.
Now the 38.2% rule tells us it needs to make a new low in order to keep the trend negative and a failure to do so should send it to 61.8% (345.00) of the same move.
Once again before we get there let's look at the movement away from 38.2%. The first setback hit 61.8% on 8/19/21, the target from 61.8% should be 61.8% the other way. It did this and more by going to 78.6% at 281.00 on 9/3/21. The break from 281.00 sent it to 78.6% the other way at 226.00, on 9/29/21. We are still looking for it to make a new low on the break from 38.2% on 8/11/21. The failure to do so should now send it to 61.8% at 345.00. Also at this point, being 78.6% it can be the start of the next Bull run.
The rally from 78.6% at 226.00 sent it to 61.8% at 345.00 to complete the target after hitting 38.2% and failing to make the new low.
We will now watch 38.2% at 307.00 to see if this trend is going to continue, if so we will look for 78.6% at 382.00 and any failure to hold 307.00 should send it down to 61.8% of the same move at 269.00.
As you can see on the chart, the retracements are an excellent tool to be used to understand the trend and the potential of any move from them.
Sign up for our Free newsletter here.
FULL RISK DISCLOSURE: Futures trading contains substantial risk and is not for every investor. An investor could potentially lose all or more than the initial investment. Commission Rule 4.41(b)(1)(I) hypothetical or simulated performance results have certain inherent limitations. Unlike an actual performance record, simulated results do not represent actual trading. Also, since the trades have not actually been executed, the results may have under- or over-compensated for the impact, if any, of certain market factors, such as lack of liquidity. Simulated trading programs in general are also subject to the fact that they are designed with the benefit of hindsight. No representation is being made that any account will or is likely to achieve profits or losses similar to those shown. Past performance is not necessarily indicative of future results.