CORN ETF part 2, Fibonacci

ONE44 Analytics where the analysis is concise and to the point
Our goal is to not only give you actionable information, but to help you understand why we think this is happening based on pure price analysis with Fibonacci retracements, that we believe are the underlying structure of all markets and Gann squares.
(CORN) ETF
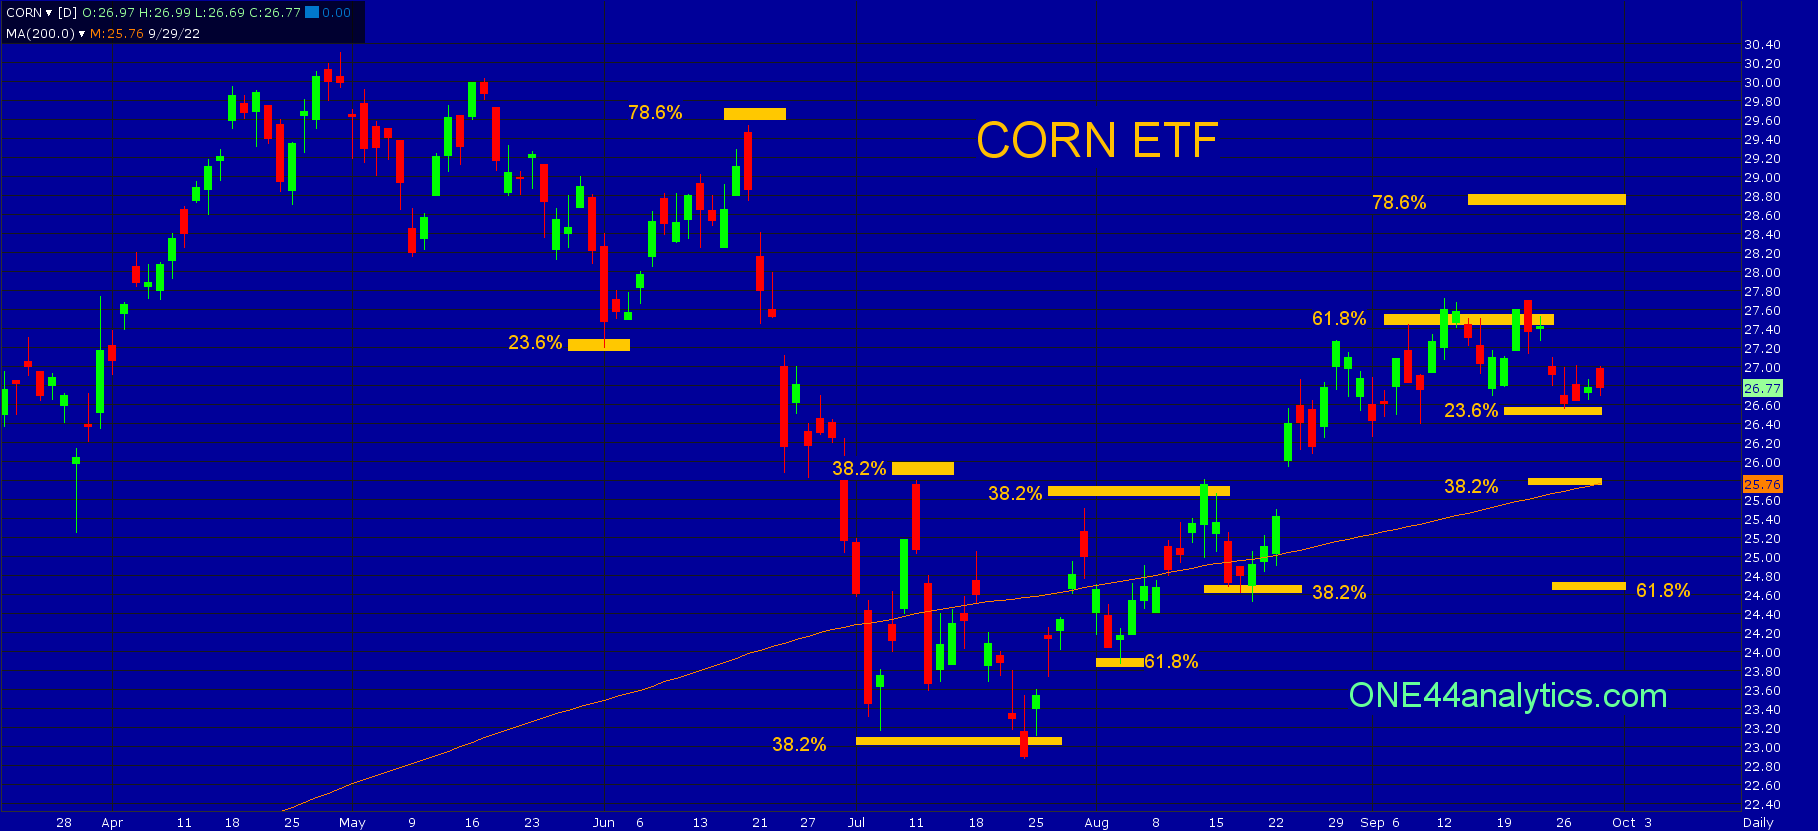
In our Tuesday post we showed you how the major Gann squares can be used to find support and resistance. In this update we will show you what all the highlighted levels were on the chart in that post.
Starting with the low on 6/1/22, this was 23.6% back to the 9/10/21 low and we were looking for new highs after holding it. As always we watch all the retracements on every move to see just how weak, or strong the market is regardless of the longer term target. The rally failed to make a new high and this came at 78.6%, following the ONE44 78.6% rule, it can send it 78.6% of where it just came from and or be the end of the Bull run. In this case it ended the Bull run and the break from it took it to 38.2% of the 8/4/20 low on 7/6/22 and then again on 7/22/22. This was our long term swing point based on the ONE44 38.2% rule.
The first rally from 7/6/22 went to 38.2% of the break from the 4/29/22 high and this sent it back to a new low on 7/22/22. This made a slightly lower low and got right back above the long term swing point. Having done this it gave us a long term target of 61.8% at 27.45, because it already reacted from 38.2% on 7/11/22 and then again on 7/29/22 and 8/12/22. Each of the setbacks from these highs held a key retracement. On 8/3/22 it was 61.8% and on 8/18/22 it held 38.2% showing the market was getting stronger.
The rally from 8/18/22 took it to 61.8% on 9/12/22 to complete the 61.8% long term target mentioned before. This now brings in the ONE44 61.8% rule and that is to look for 61.8% the other way and this is 24.75. This is the long term target. So far, It has hit 61,8% two times, the second was on 9/21/22 and the setback so far has only been able to get 23.6% back at 26.55.
Now
If 23.6% is all it can set back, it keeps the current trend very positive, however we are still looking for 24.75 longer term (61.8% rule). Above 27.45 look for 78.6% back to the 4/29/22 high at 28.70.
As you can see on this chart almost every high and low hit a Fibonacci retracement and with the ONE44 Fibonacci rules and guidelines you would know what to look for from them. In the previous post we showed you how the market traversed though the major Gann squares and when using both of these methods you can get a better understanding of the potential movement from these key levels.
Our goal is to not only give you actionable information, but to help you understand why we think this is happening based on pure price analysis with Fibonacci retracements and Gann squares.
If you like this kind of analysis and trade the Grains, give us a look Grains Weekly update.
FULL RISK DISCLOSURE: Futures trading contains substantial risk and is not for every investor. An investor could potentially lose all or more than the initial investment. Commission Rule 4.41(b)(1)(I) hypothetical or simulated performance results have certain inherent limitations. Unlike an actual performance record, simulated results do not represent actual trading. Also, since the trades have not actually been executed, the results may have under- or over-compensated for the impact, if any, of certain market factors, such as lack of liquidity. Simulated trading programs in general are also subject to the fact that they are designed with the benefit of hindsight. No representation is being made that any account will or is likely to achieve profits or losses similar to those shown. Past performance is not necessarily indicative of future results.