Corn is long term positive, but at short term resistance, 78.6%
ONE44 Analytics where the analysis is concise and to the point
Our goal is to not only give you actionable information, but to help you understand why we think this is happening based on pure price analysis with Fibonacci retracements, that we believe are the underlying structure of all markets and Gann squares.
For the ONE44 Fibonacci rules and guidelines to help with this article, go here
This is our latest video in an ongoing series of how to use the Fibonacci retracements. Even if you do not trade the market covered, the ONE44 rules and guidelines are the same, as we believe the Fibonacci retracements are the underlying structure of all markets.
https://youtu.be/HEyLVbjvHDg
Charts are courtesy of Barchart.com
Corn
In our previous post on 12/8/21 we left you with this,
The second break from 61.8% (590.00) did hold 38.2% again, this time at 563.00. The rally from there is now approaching 61.8% for the third time. We know from following the ONE44 38.2% rule that we should see new highs for the move to keep the trend positive. Provided they can get through 590.00 this time, look for 78.6% of that same move up at 613.00. We also know when following the 38.2% rule that a failure to make a new high should send it down to 61.8% of the same move and this is 542.00, so both the 38.2% and 61.8% rules point to 542.00 on a break from 590.00. The long term trend remains positive as long as it stays above 38.2% of the contract high and low at 522.00. The long term target is still up at 810.00.
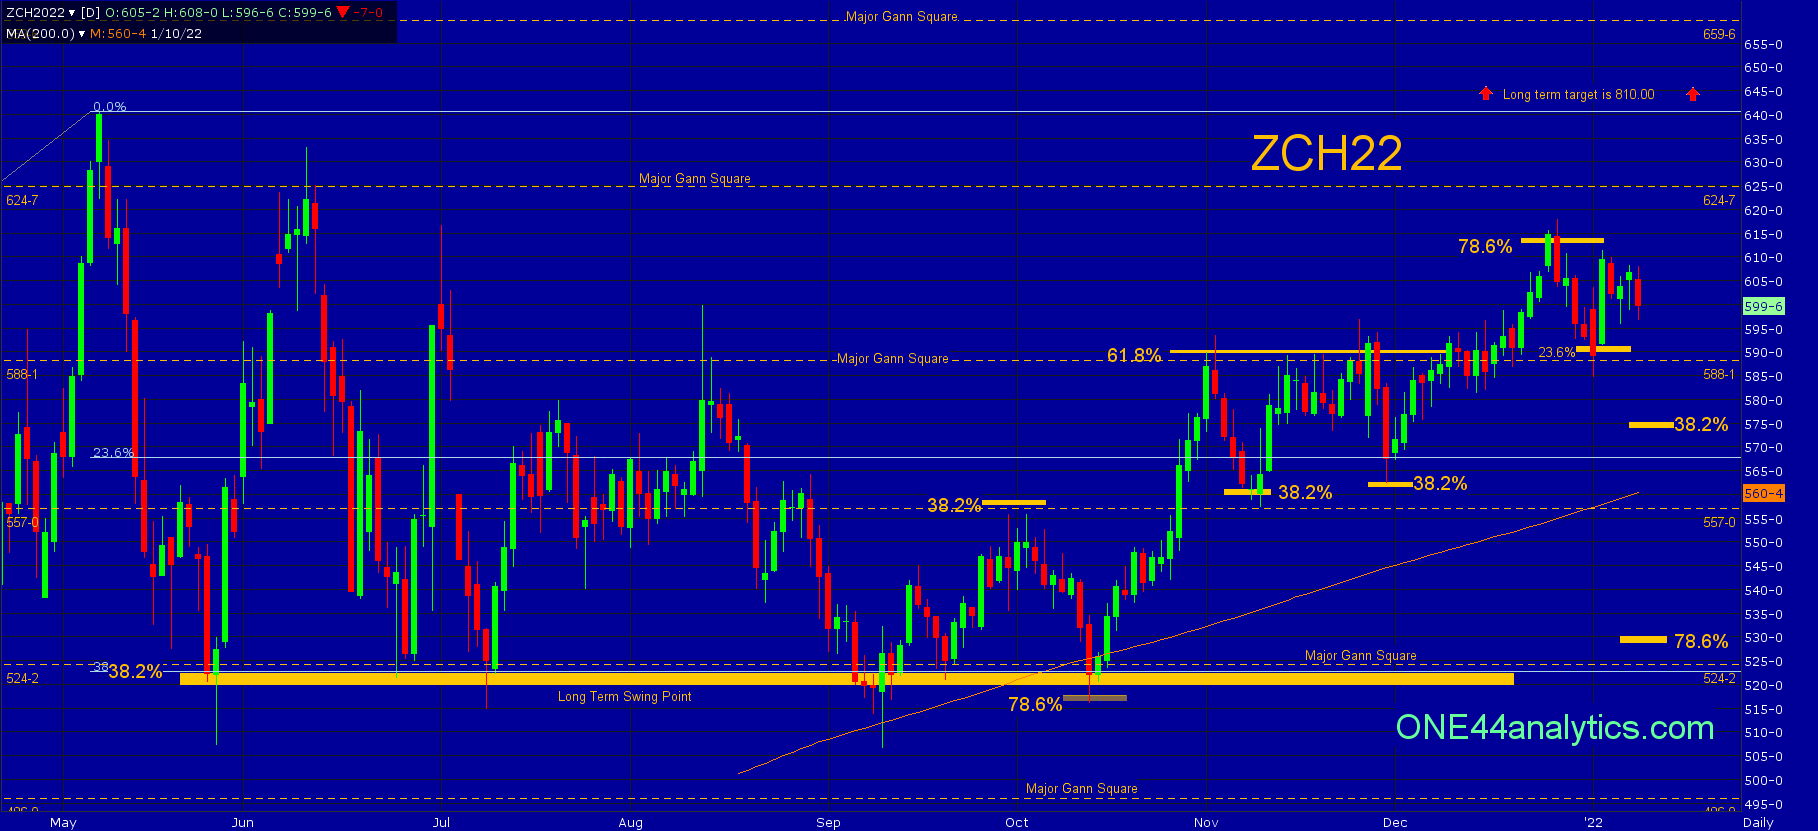
Today,
It did hold 38.2% on 11/30/21 and finally took out 61.8% at 590.00 after setting back from it twice. This gave us the next target of 78.6% at 613.00, it hit this on 12/27/21 and closed just above it, however the next day was right back below it (we always want to see two closes above/below a key level to violate it). Following the ONE44 Fibonacci rules and guidelines, we know a break from 78.6% can send it 78.6% the other way and this is 530.00 and as always we watch all the retracements on each move to see just how strong, or weak the market is regardless of the longer term target. So far, the setback from 78.6% has held 23.6% of the recent rally at 590.00, it did have one close below, but the next day was right back above it. Holding 590.00 should send it to new highs and a failure to do so brings back the target of 530.00 below. The short term swing point is 38.2% of the recent rally at 575.00, if this is all they can setback from 613.00 everything remains very positive and you can look for the major Gann squares of 624.75 and 659.75. Our long term target is 810.00 and as long as it stays above the long term swing point of 523.00 the idea of a multi-year rally is still intact that we first mentioned was possible in the fall of 2020.
If you are looking for option plays to go with our levels, we highly recommend going to the Barchart webinar library where John Rowland has plenty of information on Option strategies.
Here is one, Using the Long Strangle Options Strategy for Opportunity Trades
Sign up for our Free newsletter here.
FULL RISK DISCLOSURE: Futures trading contains substantial risk and is not for every investor. An investor could potentially lose all or more than the initial investment. Commission Rule 4.41(b)(1)(I) hypothetical or simulated performance results have certain inherent limitations. Unlike an actual performance record, simulated results do not represent actual trading. Also, since the trades have not actually been executed, the results may have under- or over-compensated for the impact, if any, of certain market factors, such as lack of liquidity. Simulated trading programs in general are also subject to the fact that they are designed with the benefit of hindsight. No representation is being made that any account will or is likely to achieve profits or losses similar to those shown. Past performance is not necessarily indicative of future results.