Corn splits 61.8% and a major Gann square, now what?
ONE44 Analytics where the analysis is concise and to the point
Our goal is to not only give you actionable information, but to help you understand why we think this is happening based on pure price analysis with Fibonacci retracements, that we believe are the underlying structure of all markets and Gann squares.
For the ONE44 Fibonacci rules and guidelines to help with this article, go here.
Charts are courtesy of Barchart.com
Corn
In the last post on 2/7/22, we left you with this,
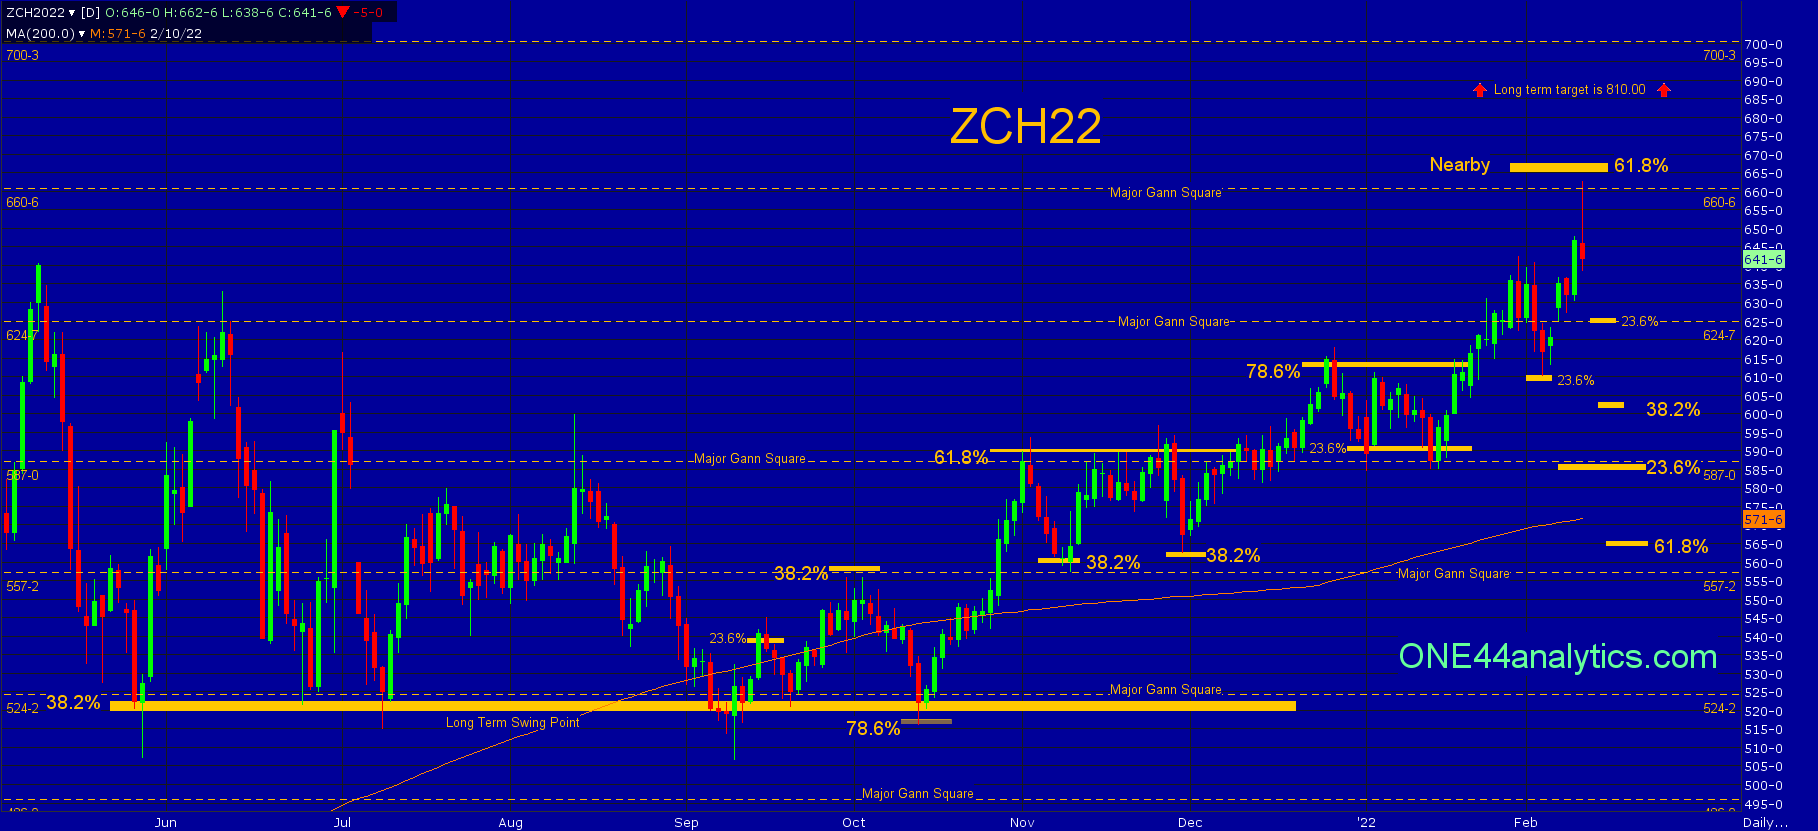
"With new highs we are looking for the next major Gann square at 660.75 and 61.8% back to the ATH based on the Nearby chart, this is 665.00. Failing to turn lower from this area should send to the next major Gann square at 700.25. Our long term target remains 810.00."
The high today (662.75) split the 660.75 major Major Gann square and the 61.8% retracement back to the ATH based on the Nearby chart at 665.00. Following the ONE44 Fibonacci rules and guidelines, we know to look for a move of 61.8% the other way and this would be 565.00. As always we will watch all the retracements on every move to see just how weak, or strong the market is regardless of the longer term target.
As you can see on the chart below, each of the setbacks from 38.2% on 9/30/21, 61.8% on 11/2/21 and 11/24/21 and 78.6% on 11/28/21 all held shorter term retracements even though we were looking for more on each setback. By holding the levels of 38.2% on 11/9/21 and 11/30/21 and then 23.6% on 1/3/22 and 1/14/22 and lastly 23.6% on 2/3/22 (also marked on chart) you could see how much stronger the market was getting.
Knowing our longer term target is 61.8% at 565.00 on a break from this area, we will now look at the key areas that can turn this market right back up. The first is 23.6% of the rally from when it last hit the long term swing point (518.00) in September of last year, this is 625.00, it is also a major Gann square. If this is all it can setback the trend remains extremely positive and they should go for new highs. The next area is 587.00, this is both a major Gann square and 23.6% back to the contract low.
On a close above 665.00 look for the next major Gann square at 700.25. The long term target remains at 810.00.
Sign up for our Free newsletter here.
FULL RISK DISCLOSURE: Futures trading contains substantial risk and is not for every investor. An investor could potentially lose all or more than the initial investment. Commission Rule 4.41(b)(1)(I) hypothetical or simulated performance results have certain inherent limitations. Unlike an actual performance record, simulated results do not represent actual trading. Also, since the trades have not actually been executed, the results may have under- or over-compensated for the impact, if any, of certain market factors, such as lack of liquidity. Simulated trading programs in general are also subject to the fact that they are designed with the benefit of hindsight. No representation is being made that any account will or is likely to achieve profits or losses similar to those shown. Past performance is not necessarily indicative of future results.