Corn update
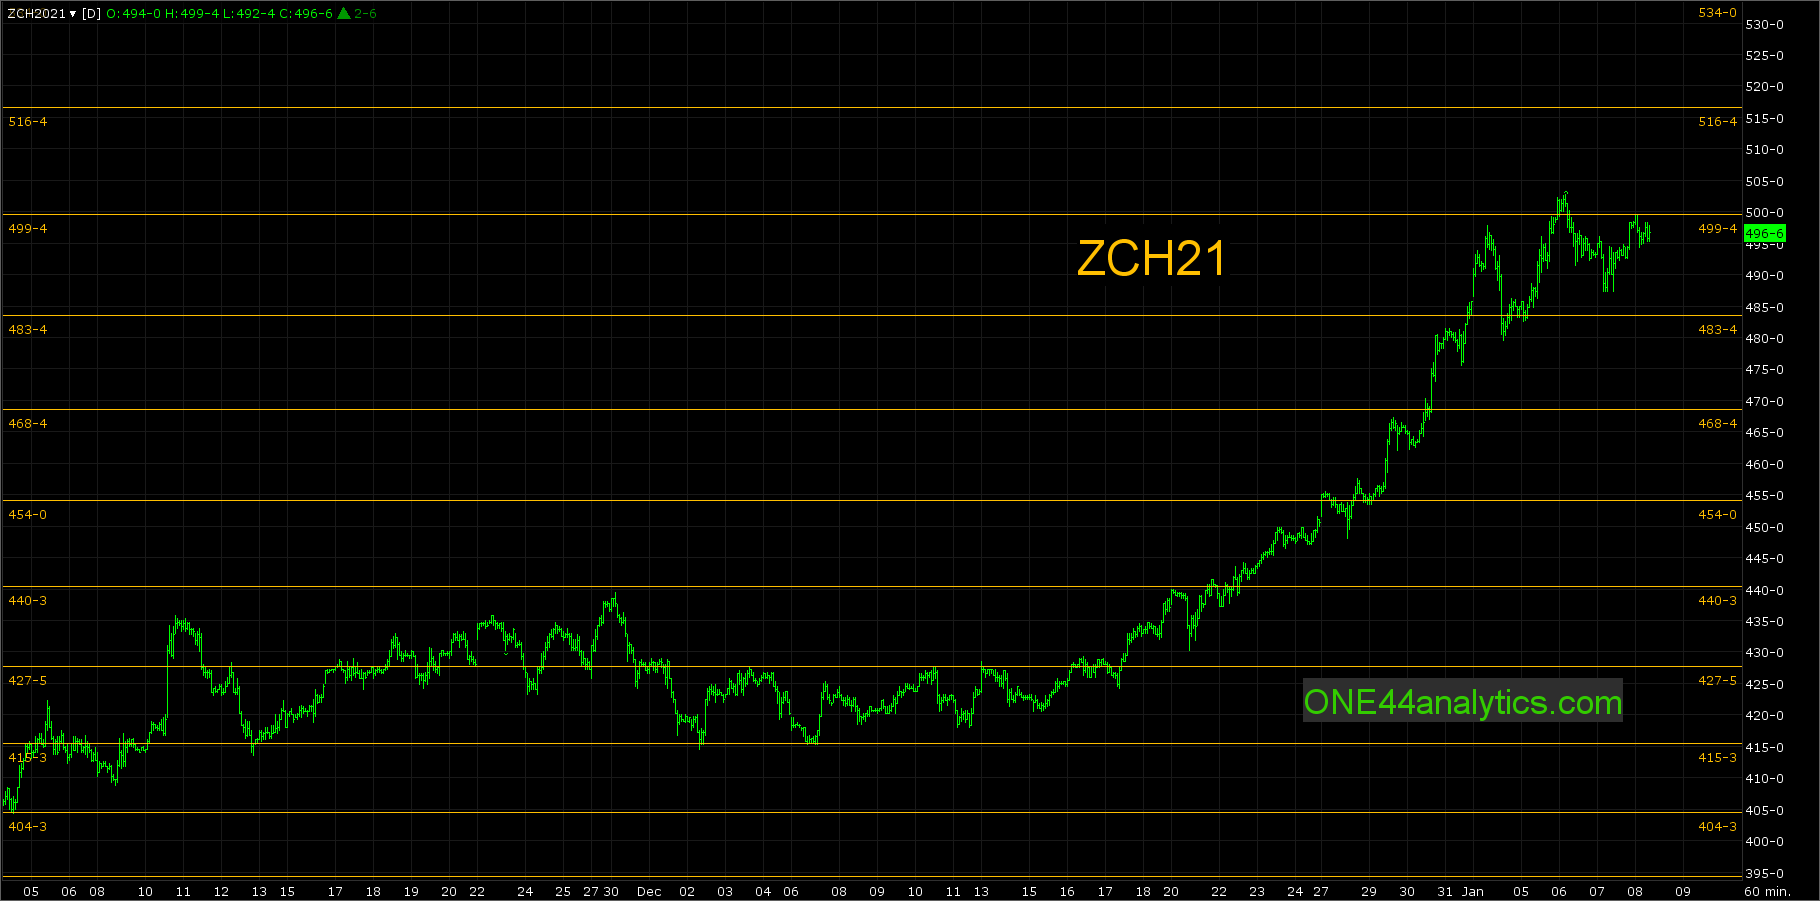
ZCH21
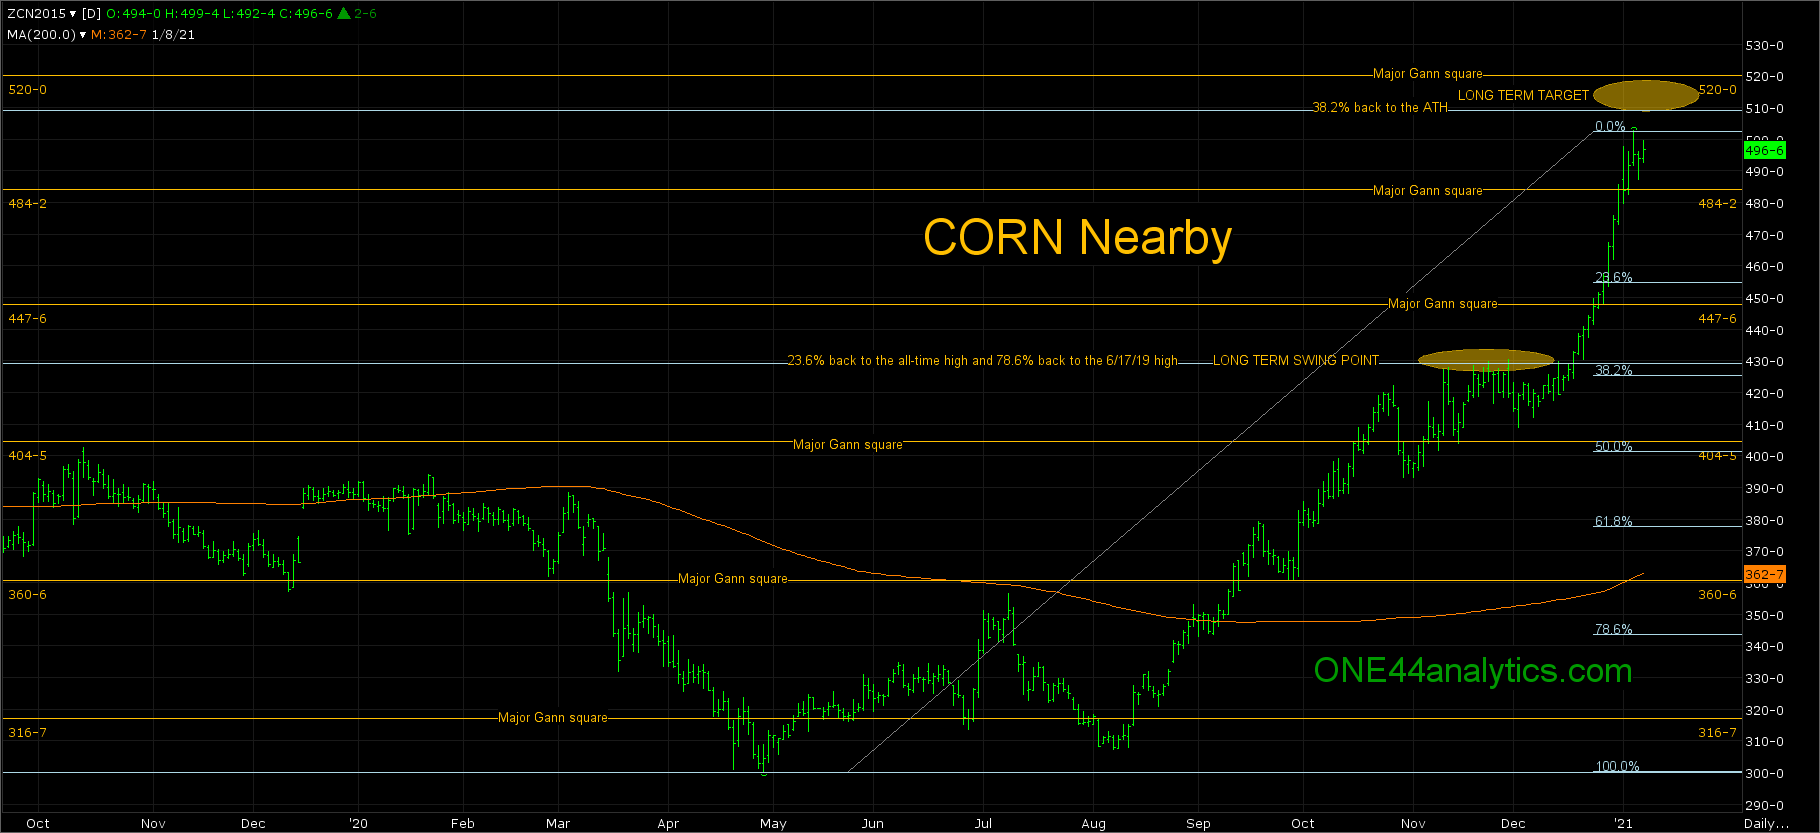
Corn is getting close to our long term target area of 510.00 to 520.00. While we have been saying since the fall of last year that we think this can be a multi-year rally, this area can put a hold on it, or even cause a good setback.
These two levels represent 38.2% back to the all-time high at 510.00 and a major Gann square at 520.00. The 38.2% rule says a break from here can take it back to new lows, that's not what we think at this moment, however it could take it back to 38.2% of the move up, this is currently 427.00. This would also put it back on the November highs and the long term swing point.This level will move up with new highs. As always on any setback, if and when it happens we will watch all the retracements and if it can only get to 23.6% of the move at 455.00 it would keep the market very strong.
Provided the 510.00 to 520.00 does not turn the market lower, a couple closes above 520.00 will give us a new long term target area of 638.00 and 648.00. This is 61.8% back to the ATH and a major Gann square. You can use each of the major Gann squares before this as short term swing points once they close above them. These are 556.00, 598.00 and 620.00.
For right now use the 484.00 major Gann square as the short term swing point and the long term swing point remains at 430.00.
You can use the Gann secondary square chart below for short term support/resistance, targets and swing points. These are marked by the yellow horizontal lines.
Sign up for our Free newsletter HERE
These are our latest videos on how to use the Fibonacci retracements. Even if you do not trade the market covered the rules and guidelines are the same, as we believe the Fibonacci retracements are the underlying structure of all markets.
https://www.youtube.com/watch?v=zhhE4cY4gHs
https://www.youtube.com/watch?v=qKYKtSjm3PQ&ab_channel=ONE44Analytics