Crypto
ONE44 Analytics where the analysis is concise and to the point
Our goal is to not only give you actionable information, but to help you understand why we think this is happening based on pure price analysis with Fibonacci retracements and Gann squares.
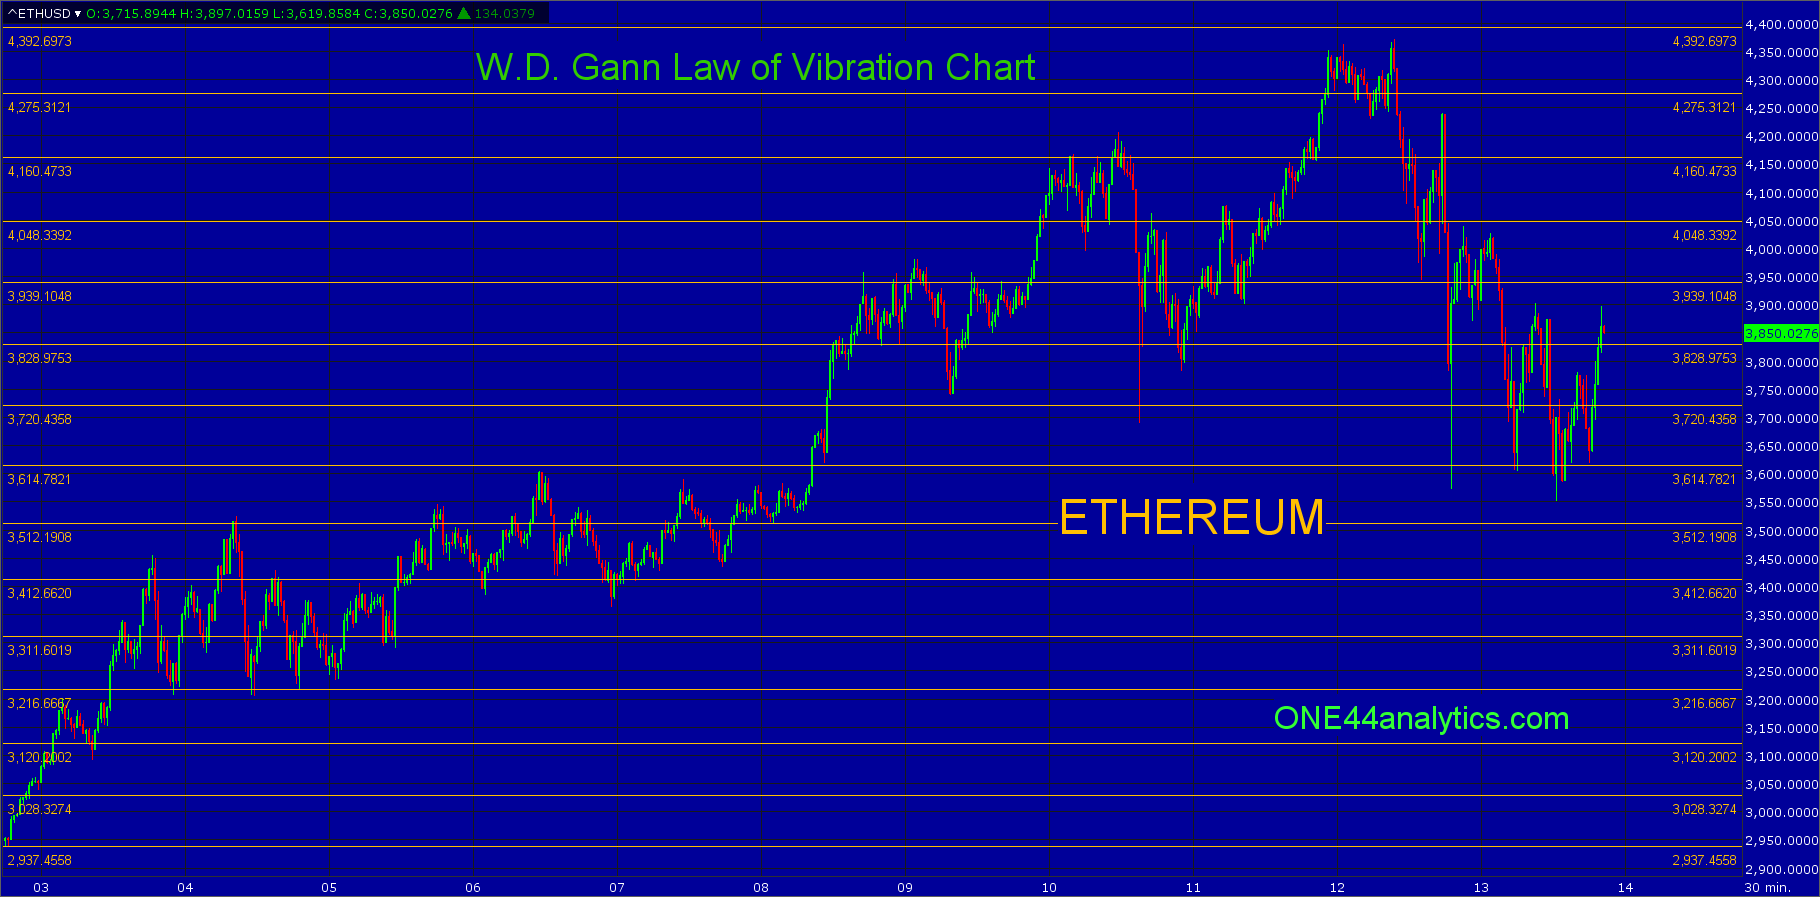
ETHEREUM
Tuesday's high was just short of the long term target of 4410.00. We will now see if the Elon break will be elongated.
All of the key levels have moved up, the break so far has hit the 3560.00 major Gann square and just below 23.6% (3660.00) back to the 3/1/21 low. You can use 3660.00 as the short term swing point for now, above it look for a retest of the 4410.00 long term target, below it look for the area of 3380.00 to 3344.00. The first is 23.6% back to the 2018 low and the second is a major Gann square.
We know based on the ONE44 Fibonacci rules and guidelines, that a market that only retraces 23.6% keeps a market extremely strong and that it must hold 38.2% to keep the trend intact. So, if all they can do on this setback is get down to 3380.00, look for new all-time highs. On a failure to hold 23.6% look for the area of 2750.00 to 2710.00 this is 38.2% back to the 2018 low and a major Gann square.
The long term swing point is now 2750.00, taking this out would do major damage to the long term trend.
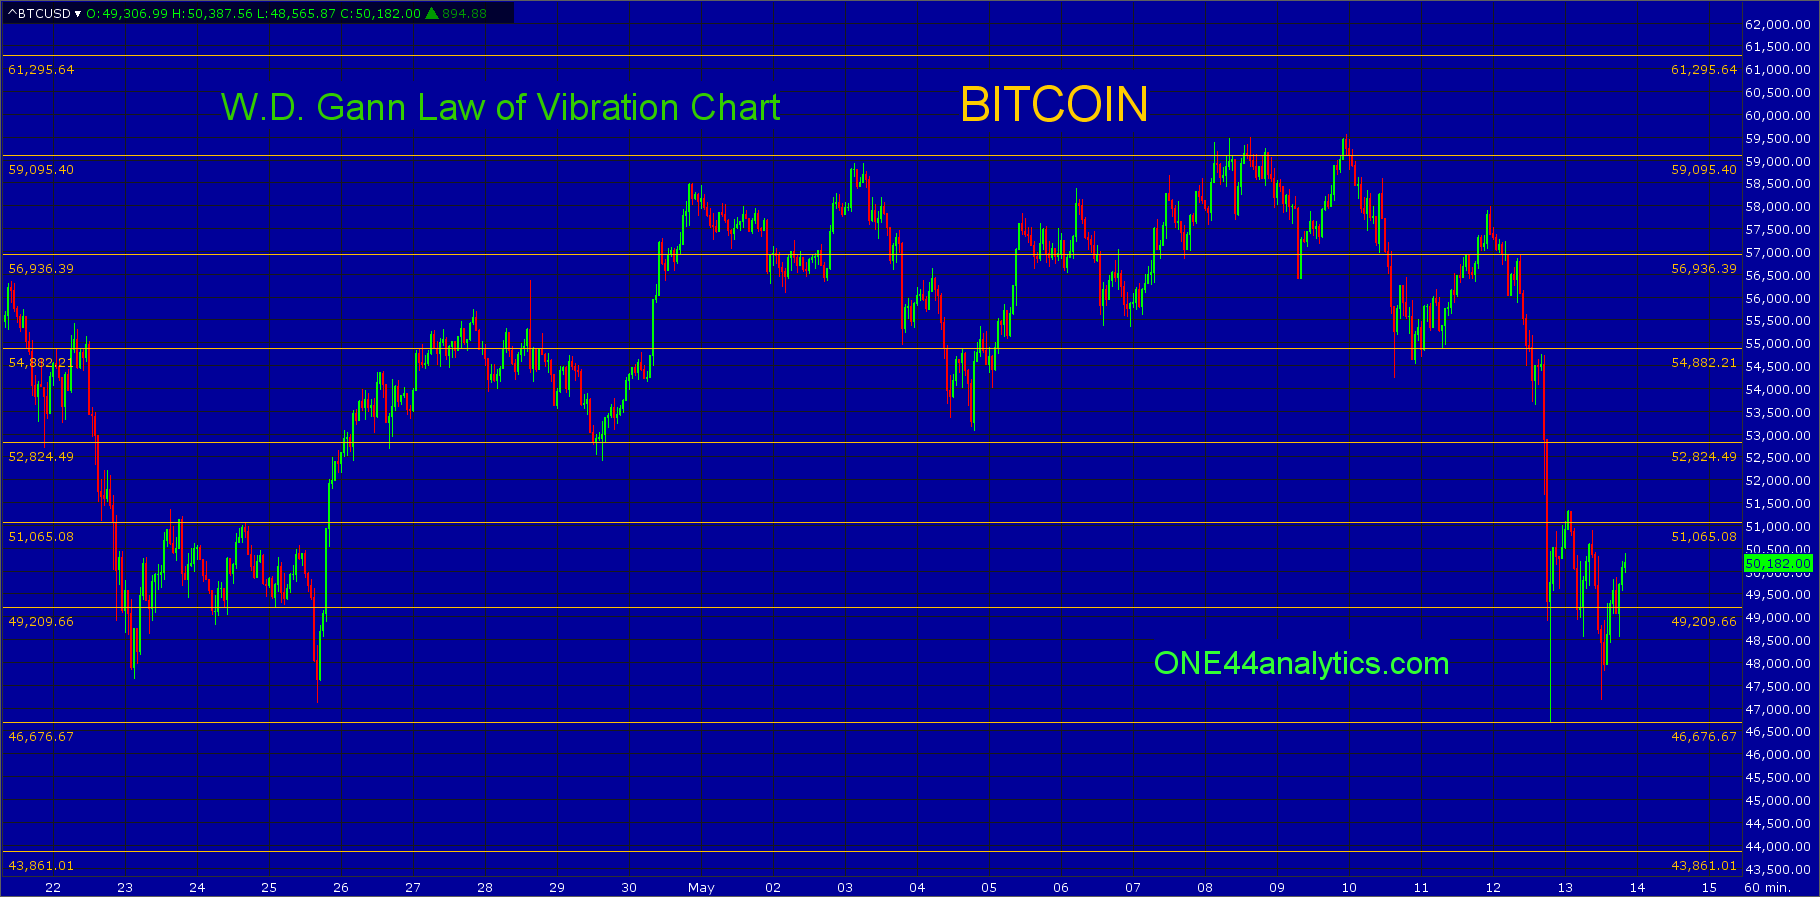
On both the Ethereum and Bitcoin charts you can use the major Gann squares as support and resistance, they are marked by the yellow horizontal lines.
The second set of charts are Gann squares on an Hourly basis and can be used as short term support and resistance.
You can find the short term Gann square charts on Litecoin, Ripple and Dogecoin on our website as well.
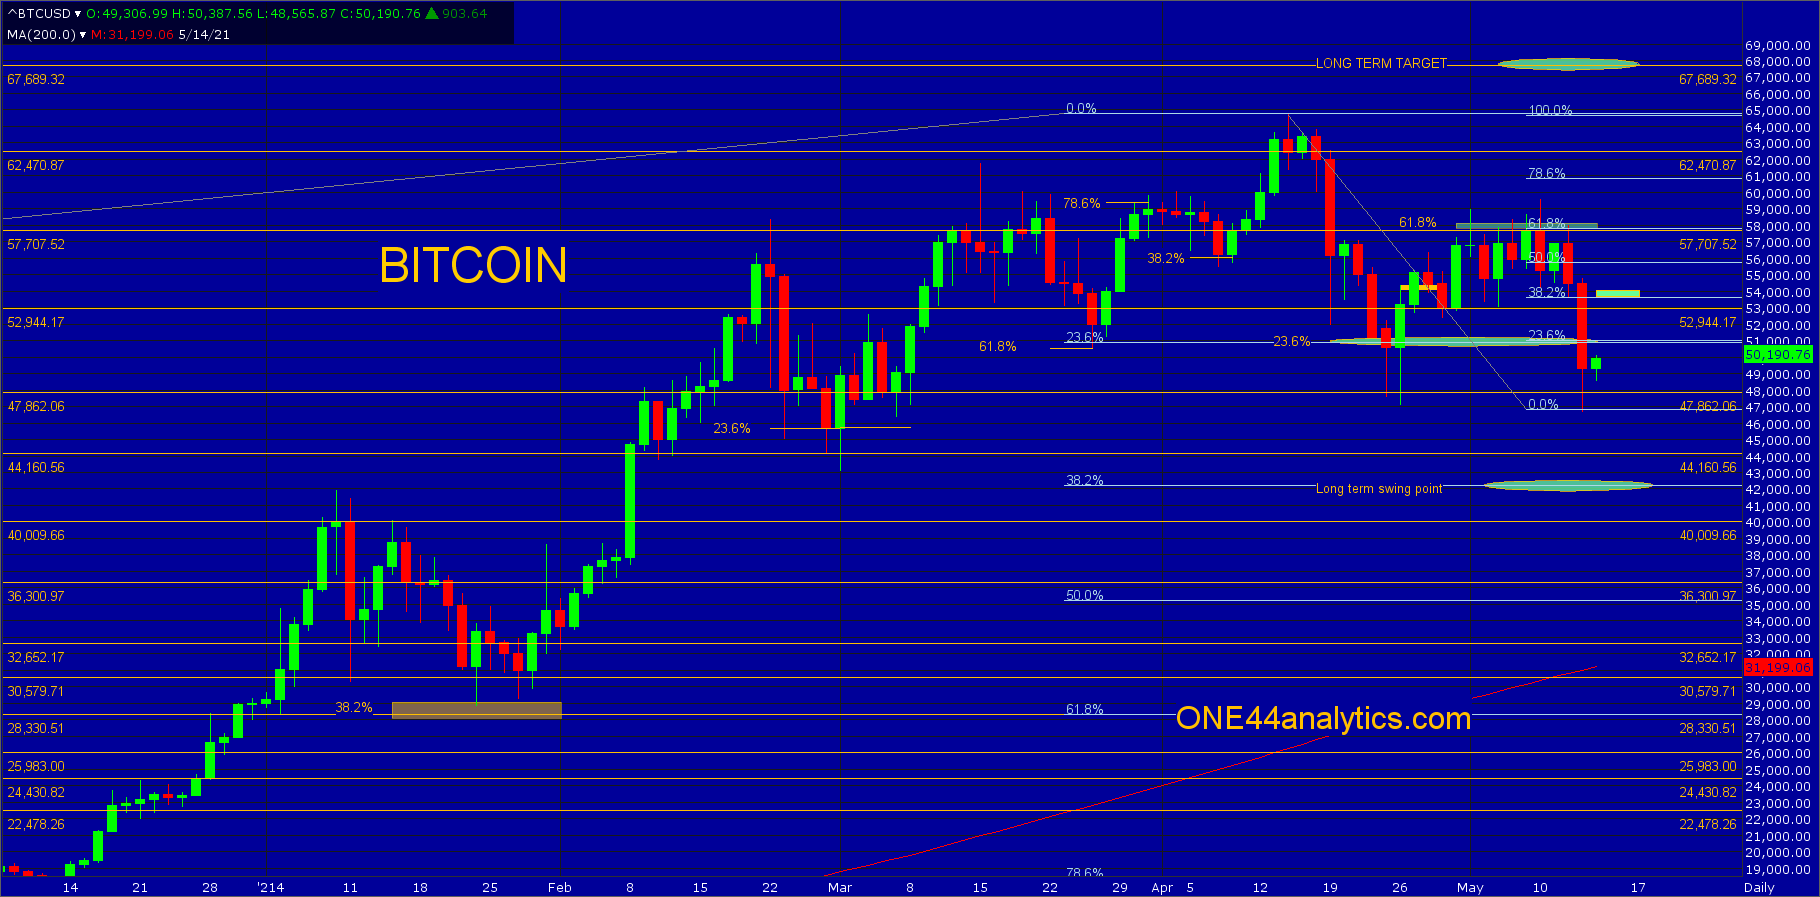
BITCOIN
While Ethereum was making new all-time highs, Bitcoin could not get a close above our 57700 swing point, this was 61.8% back to the ATH and a major Gann square. The Elon break took it down to new lows for the move and it closed below 23.6% (50900) back to the 2018 low. Having done this we can now watch 53700, this is 38.2% back to the ATH and is our short term swing point. Any rally that fails to get back above 50900 would be a very negative sign, this is not only 23.6% back to the 2018 low, but 23.6% back to the ATH. Failing to get above there should send it down to the long term swing point of 42250. This is 38.2% back to the 2018 low.
Provided they can get above 50900 (38.2%) the break should be over and you can look for the long term target of 67700.
Always keep an eye on the Major Gann squares for support and resistance
You can get all the rules and guidelines to the Fibonacci retracements on our website.
Sign up for our Free newsletter here.