Cryptocurrencies, Cardano, Litecoin and Ripple
fi
ONE44 Analytics where the analysis is concise and to the point
Our goal is to not only give you actionable information, but to help you understand why we think this is happening based on pure price analysis with Fibonacci retracements, that we believe are the underlying structure of all markets and Gann squares.
For the ONE44 Fibonacci rules and guidelines to help with this article, go here.
Charts are courtesy of Barchart.com
Cryptocurrencies
This is to show you why knowing where the Fibonacci retracements are, IS so valuable regardless of the market.
You can get all of our Gann Law of Vibration charts with short term support and resistance for FREE here.
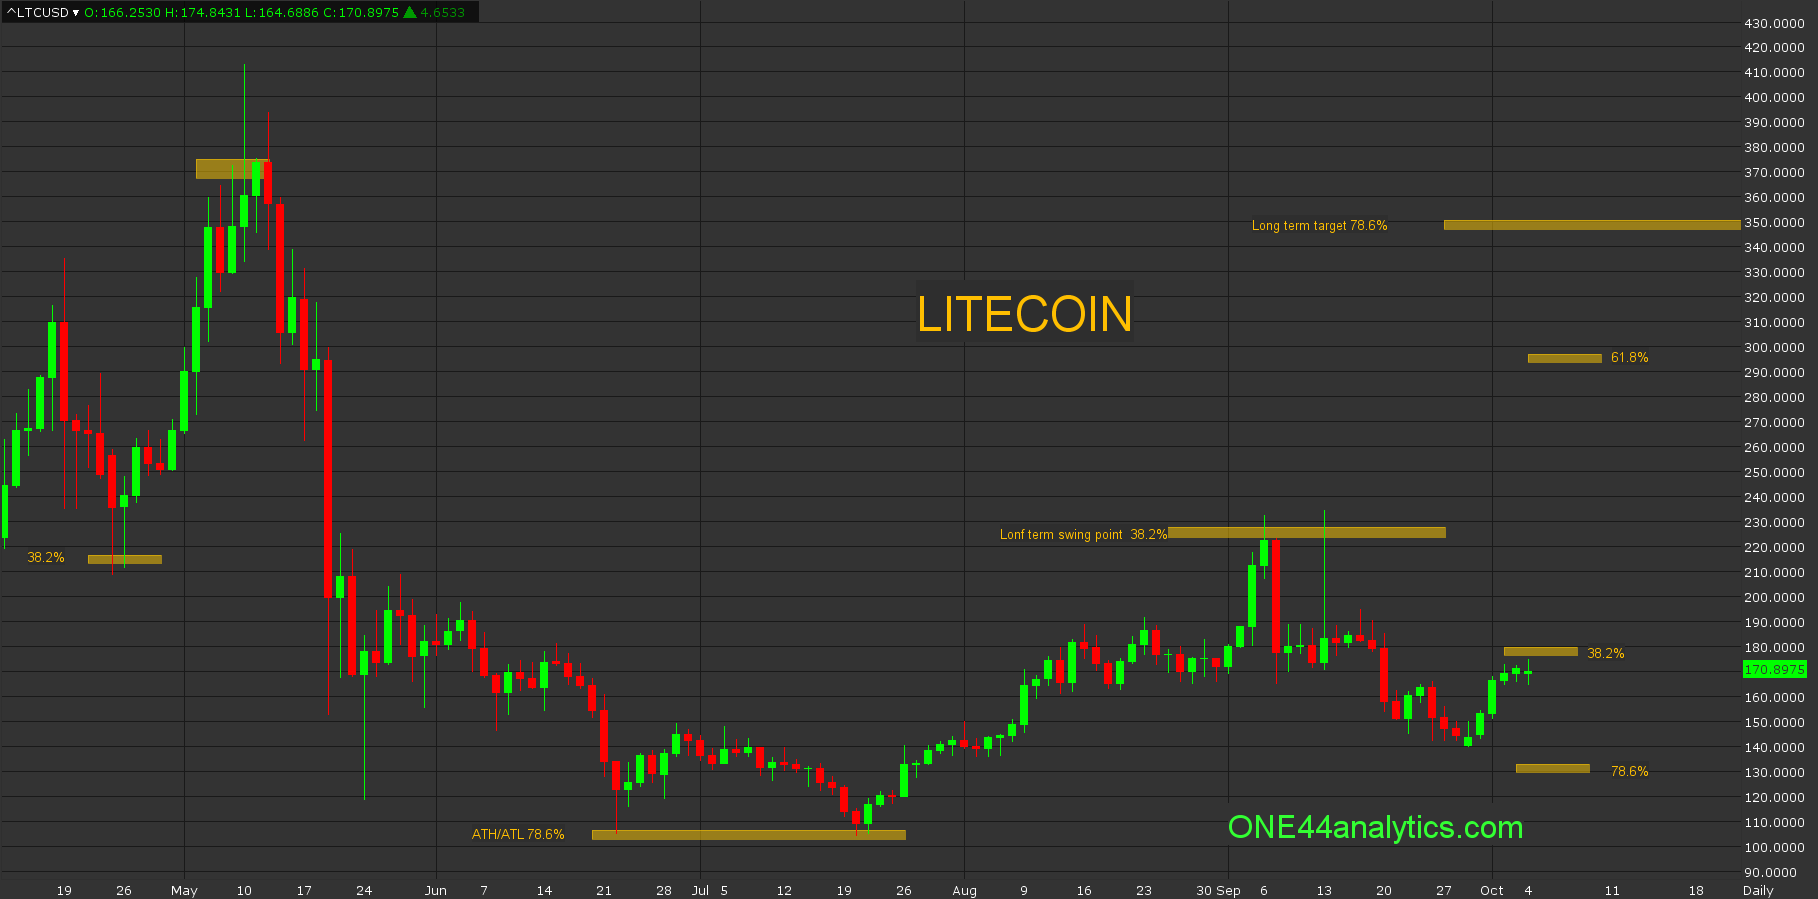
Litecoin
The low in June was 78.6% of the ATH and ATL, the long term target based on the ONE44 Fibonacci 78.6% rule is to look for 78.6% the other way and this is 345.00, however we watch all the retracements on any move and the rally stopped at 38.2% in September, this is the long term swing point. The break from there so far has not made a new low and if it doesn't then we will look for 61.8% the other way and this would be 297.00. In the short term they still need to get above 38.2% back to the September high, this is 180.00 and it is the short term swing point.
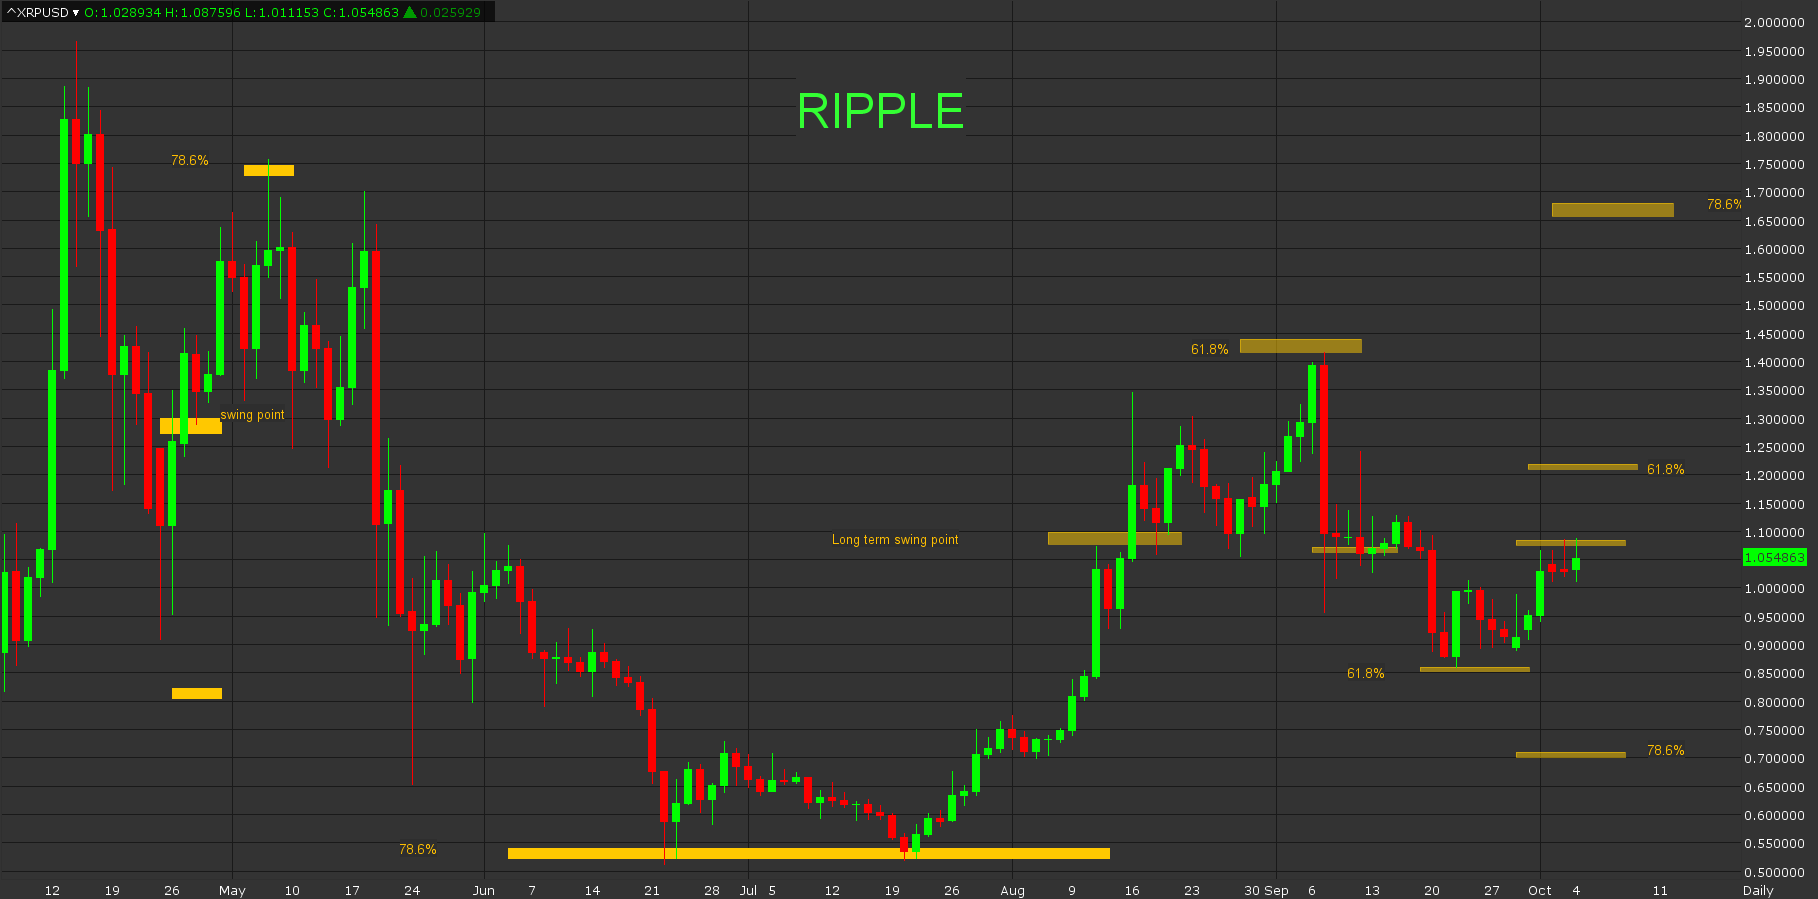
Ripple
Ripple also hit 78.6% of the ATH and ATL in June and then again in July, the long term target from there is 78.6% at 1.65. On the rally from 78.6% it went to 61.8% in September at 1.40. Using the 61.8% rule, our target would be 61.8% the other way and this was achieved on 9/22/21 at 0.86. The target on a rally from there should take it up to 61.8% the other way and this is 1.21. It is currently stopped at 38.2% (1.07) and this is the short term swing point. Failing to get above here should send it down to 78.6% at 0.70.
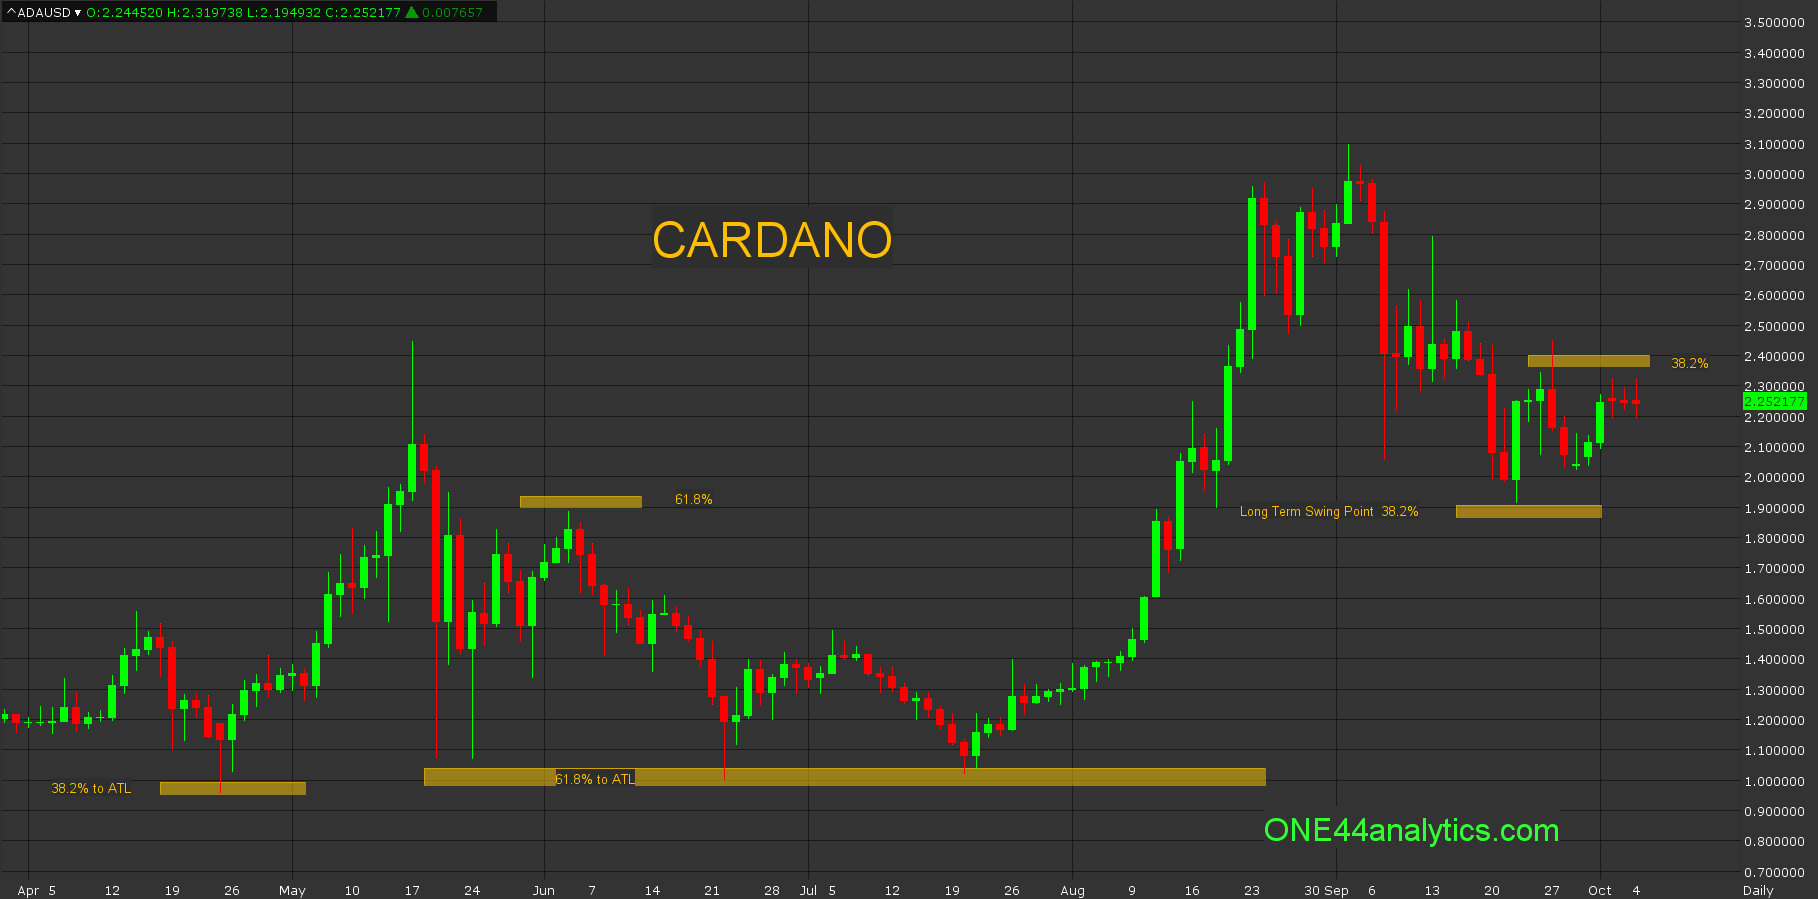
Cardano
With the short history in Cardano all the retracements and rules work the same way. The first setback on the move up this year held 38.2% at 0.99. The setback from the May ATH has been holding 61.8% of the ATH and ATL. The next big rally took it up to 3.09 and the setback from it hit 38.2% of the whole move at 1.90, this is the long term swing point. As long as it continues to close above it, look for new ATH's. The rally so far has gone up to 38.2% at 2.40 and this is the short term swing point Failing to get above it should send it to retest the long term swing point.
Sign up for our Free newsletter here
FULL RISK DISCLOSURE: Futures trading contains substantial risk and is not for every investor. An investor could potentially lose all or more than the initial investment. Commission Rule 4.41(b)(1)(I) hypothetical or simulated performance results have certain inherent limitations. Unlike an actual performance record, simulated results do not represent actual trading. Also, since the trades have not actually been executed, the results may have under- or over-compensated for the impact, if any, of certain market factors, such as lack of liquidity. Simulated trading programs in general are also subject to the fact that they are designed with the benefit of hindsight. No representation is being made that any account will or is likely to achieve profits or losses similar to those shown. Past performance is not necessarily indicative of future results.