Cryptocurrencies, Law of Vibration charts
ONE44 Analytics where the analysis is concise and to the point
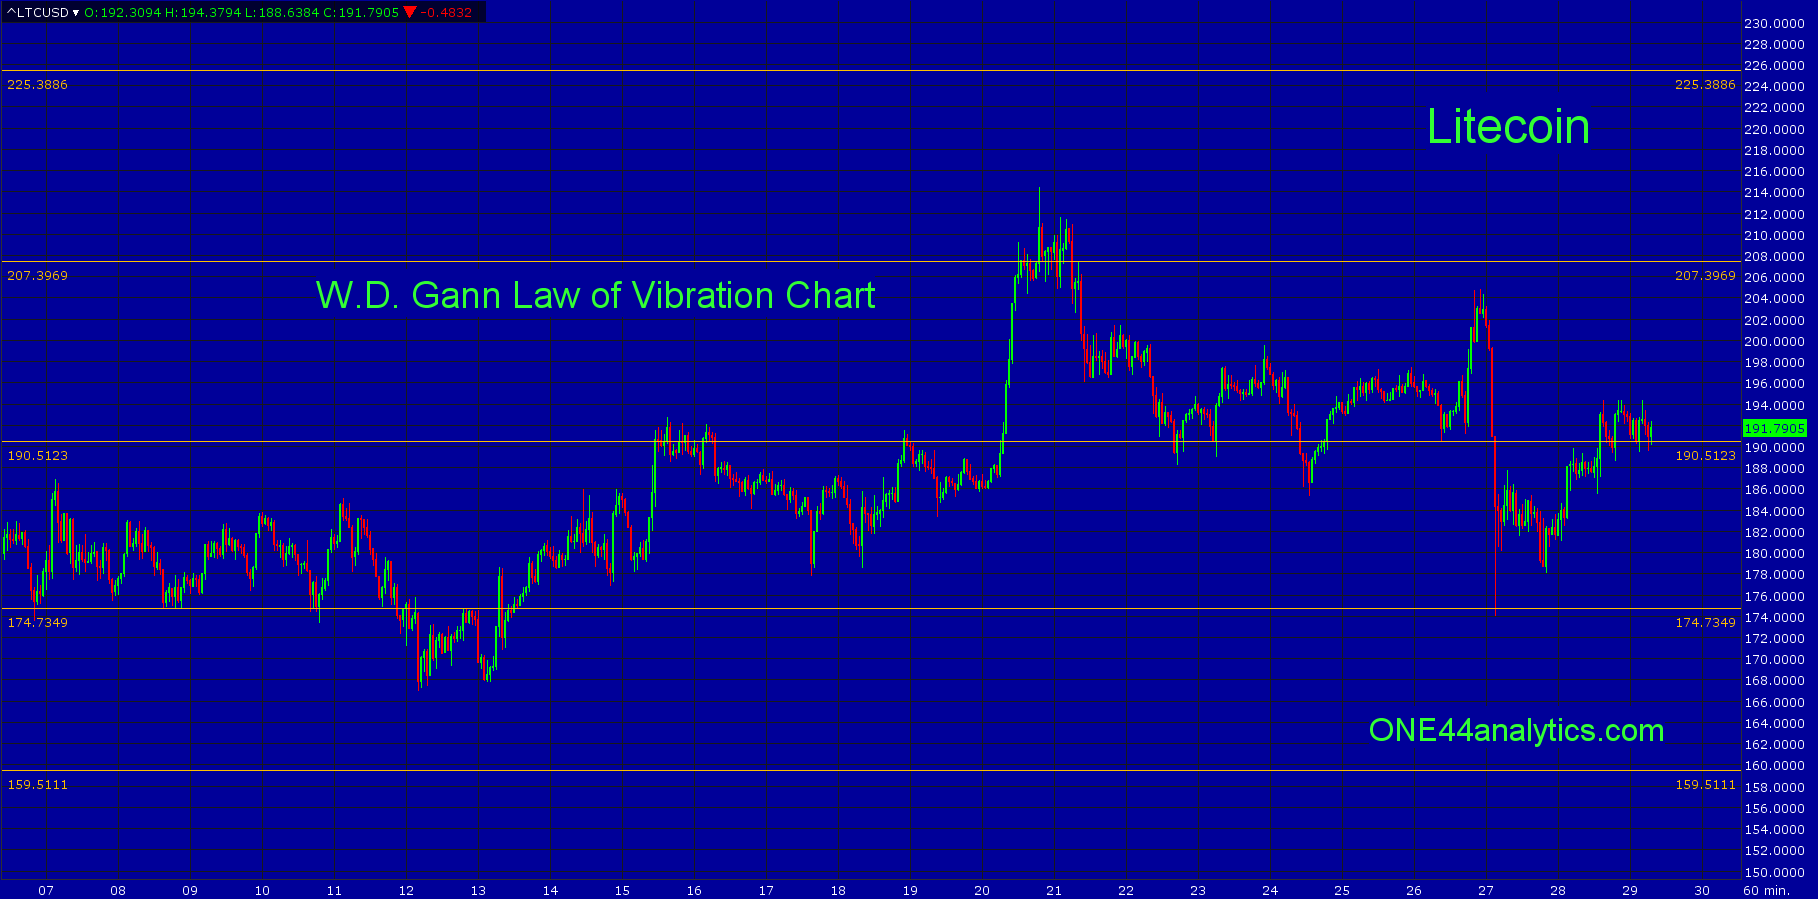
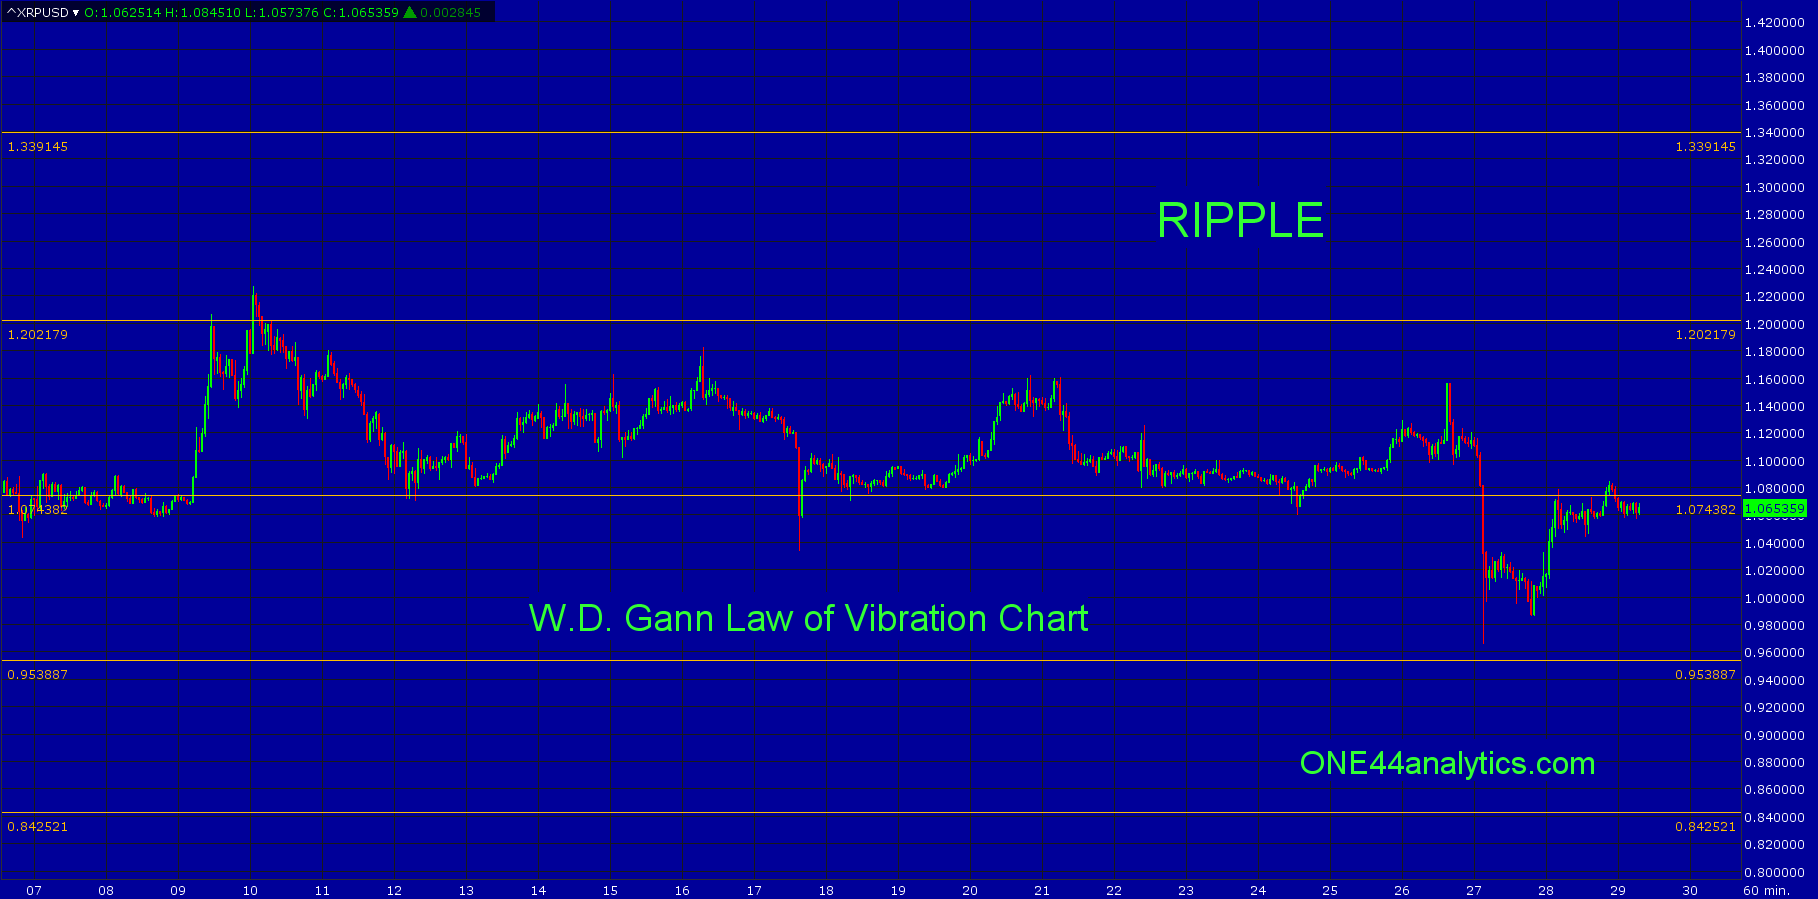
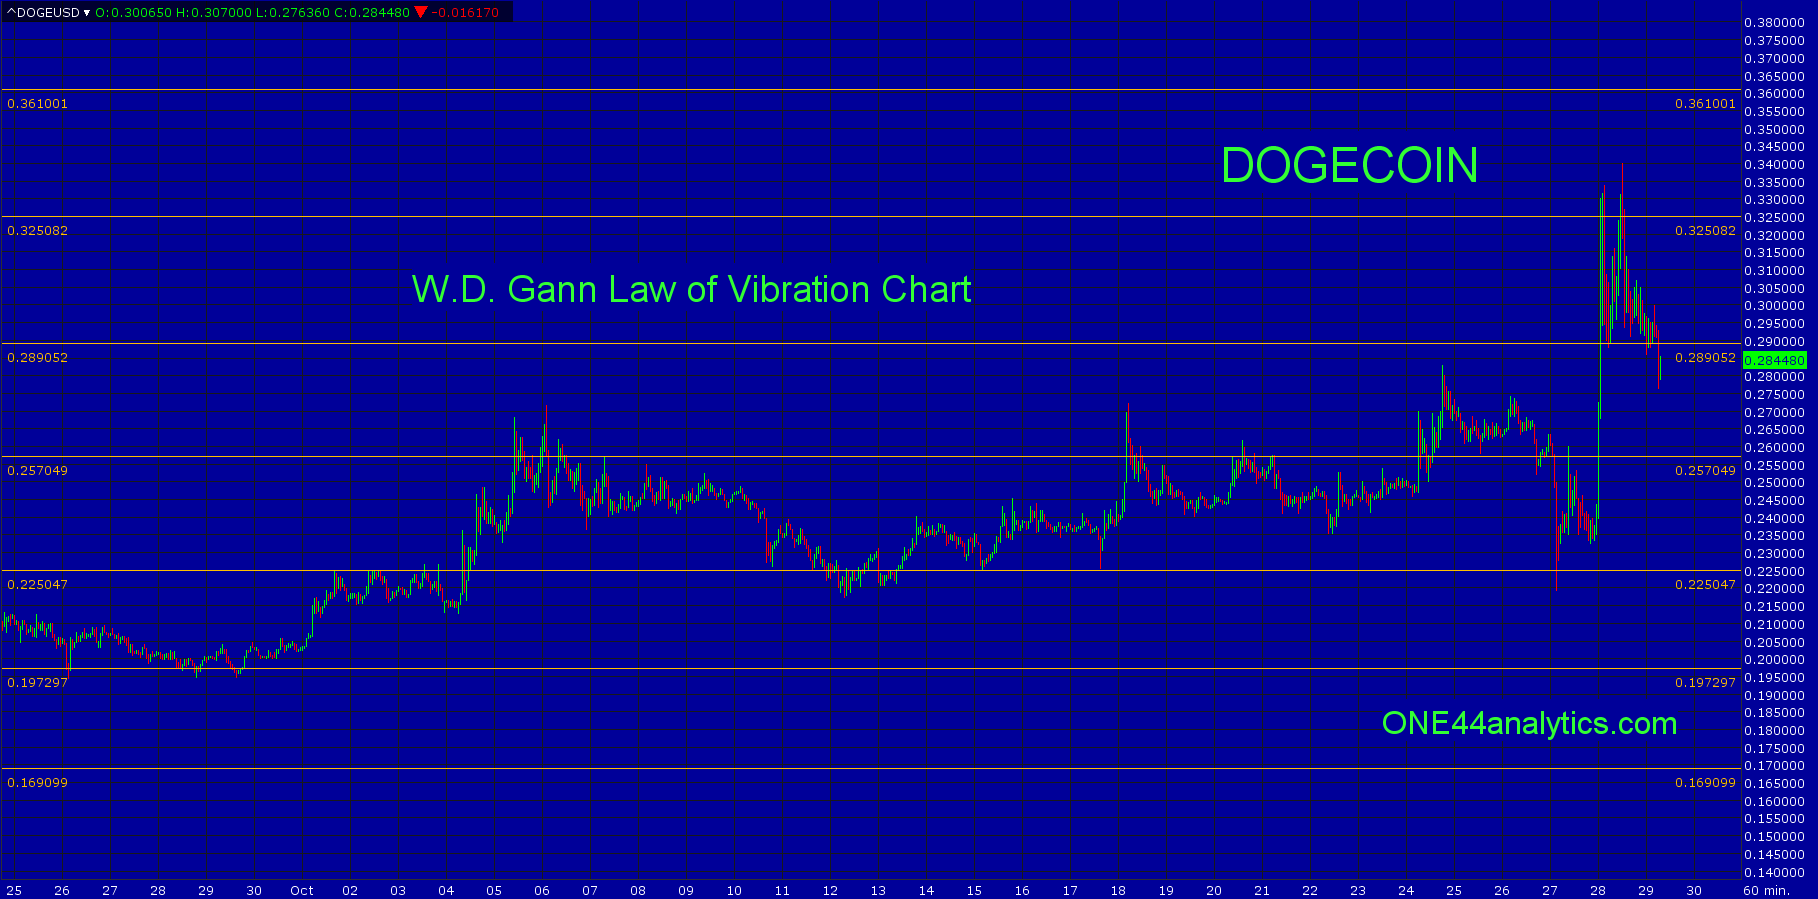
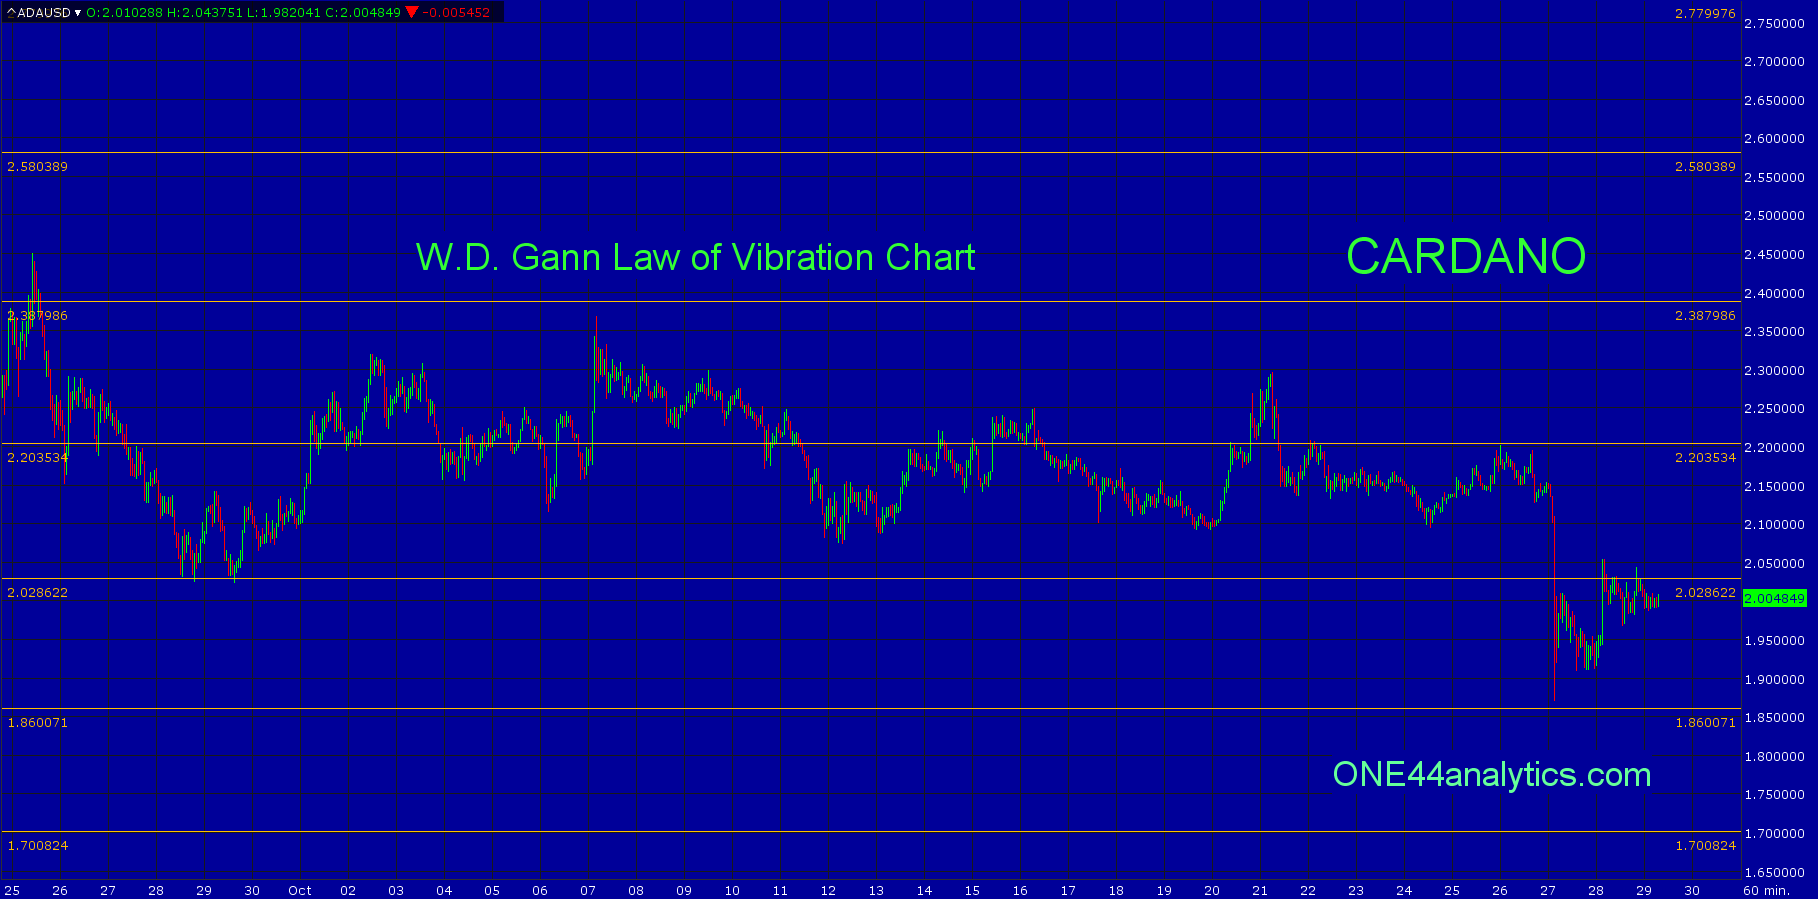
The Charts below are natural support and resistance levels that are based on W.D.Gann's "Law of Vibration".
Mr Gann viewed stocks as live electrons, atoms, and molecules which hold persistently to their own individuality in response to the fundamental Law of Vibration. Science teaches 'that an original impulse of any kind finally resolves itself into periodic or rhythmical motion, also just as the pendulum returns again in its swing, just as the moon returns in its orbit, just as the advancing year ever brings the rise or spring, so do the properties of the elements periodically recur as the weight of the atoms rises'.
Each level can be used as support and then resistance once taken out and the reverse when starting as resistance. These levels will be good until the end of each contract.
You can get these Crypto's along with Bitcoin and Ethereum updated each day for free HERE
Charts are courtesy of Barchart.com
Cryptocurrencies
Litecoin, Ripple, Dogecoin & Cardano
Sign up for our Free newsletter here.
FULL RISK DISCLOSURE: Futures trading contains substantial risk and is not for every investor. An investor could potentially lose all or more than the initial investment. Commission Rule 4.41(b)(1)(I) hypothetical or simulated performance results have certain inherent limitations. Unlike an actual performance record, simulated results do not represent actual trading. Also, since the trades have not actually been executed, the results may have under- or over-compensated for the impact, if any, of certain market factors, such as lack of liquidity. Simulated trading programs in general are also subject to the fact that they are designed with the benefit of hindsight. No representation is being made that any account will or is likely to achieve profits or losses similar to those shown. Past performance is not necessarily indicative of future results.