Cryptocurrencies, update to recent video
ONE44 Analytics where the analysis is concise and to the point
Our goal is to not only give you actionable information, but to help you understand why we think this is happening based on pure price analysis with Fibonacci retracements, that we believe are the underlying structure of all markets and Gann squares.
For the ONE44 Fibonacci rules and guidelines to help with this article, go here.
Charts are courtesy of Barchart.com
Cryptocurrencies
This is an update to the video we put out on November 15.
Litecoin, Ripple, Cardano and Fibonacci, you have to see this! https://youtu.be/HEyLVbjvHDg
A lot has happened since then.
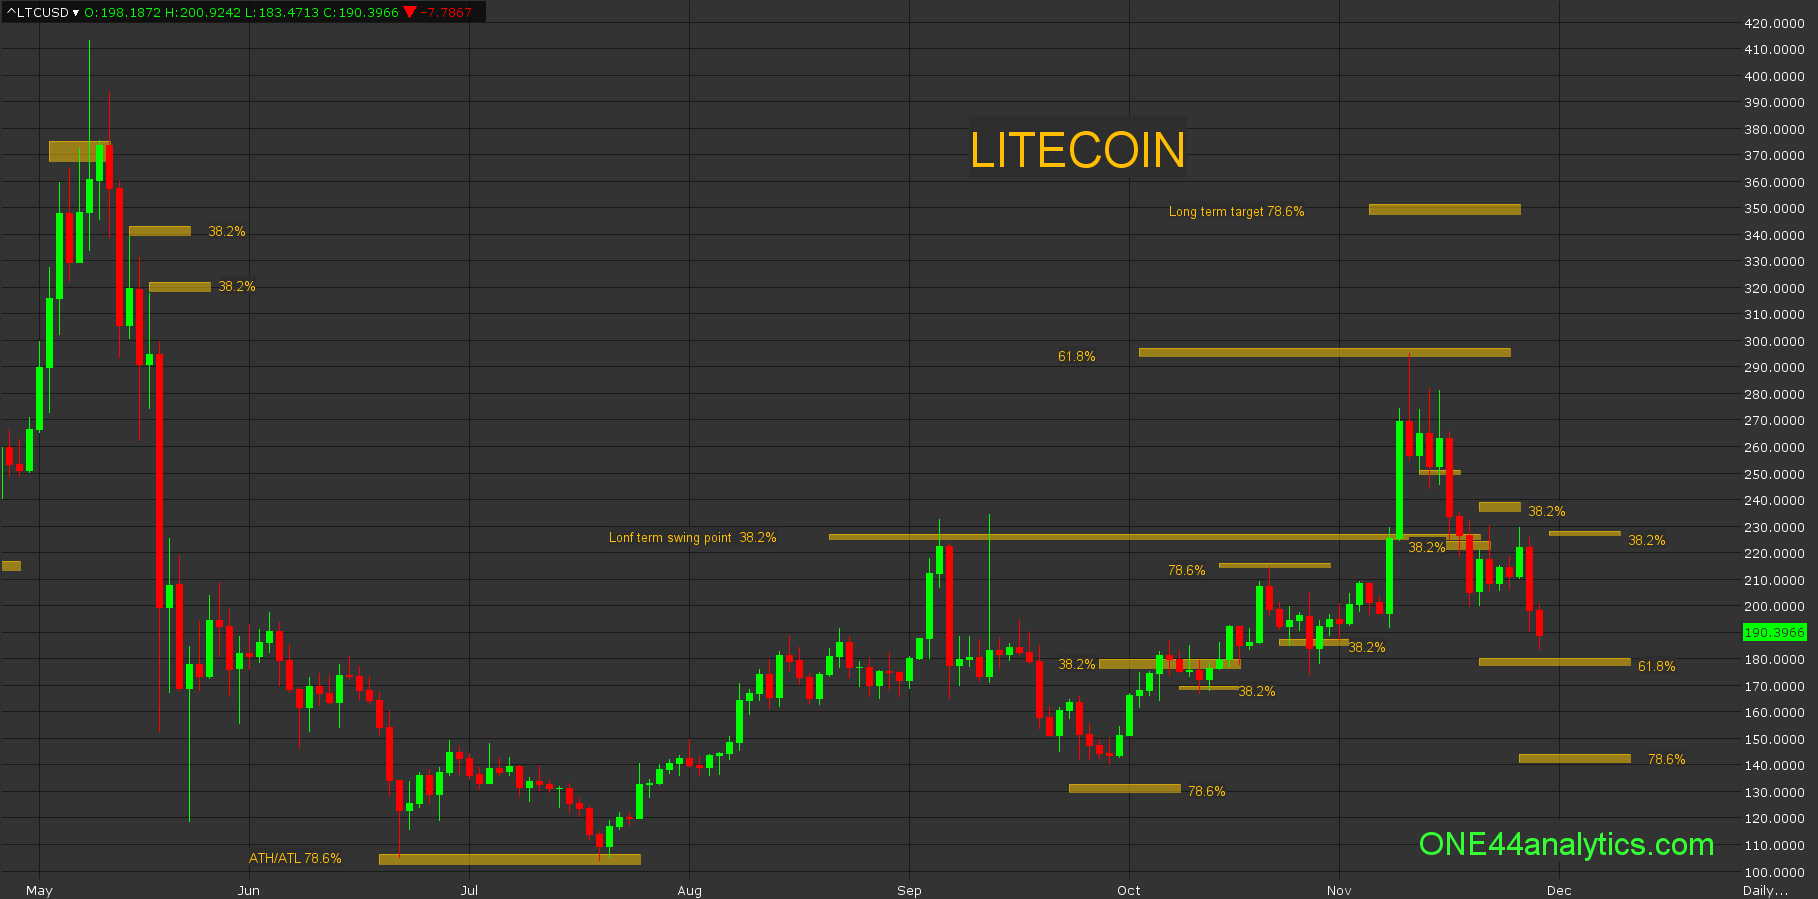
Litecoin
On November 15th it was just coming off of 61.8% at 295.00 and following the ONE44 61.8% rule we know to look for 61.8% the other way and this is 178.00 and as we always say we watch all the retracements on every move regardless of the long term target to see just how weak, or strong the market is. In this case 38.2% was 224.00 and this failed to hold up the market, so here too the next target is 61.8% (178.00) of that same move. Once 38.2% was taken out we started to watch for 38.2% of the break, this was 235.00 and they never got up to it keeping the trend negative.
As of right now they are just shy of the 61.8% target at 178.00. Holding this level can send it 61.8% back up and this would be 252.00. As we mentioned about watching all the retracements, not getting above 38.2% of the current break at 226.00 keeps the short and long term trend negative. With a solid close below 178.00 we will then look to 78.6% at 144.00.
You can get our Gann Law of Vibration charts for free on our website, these can be used for short term support and resistance for each of these markets.
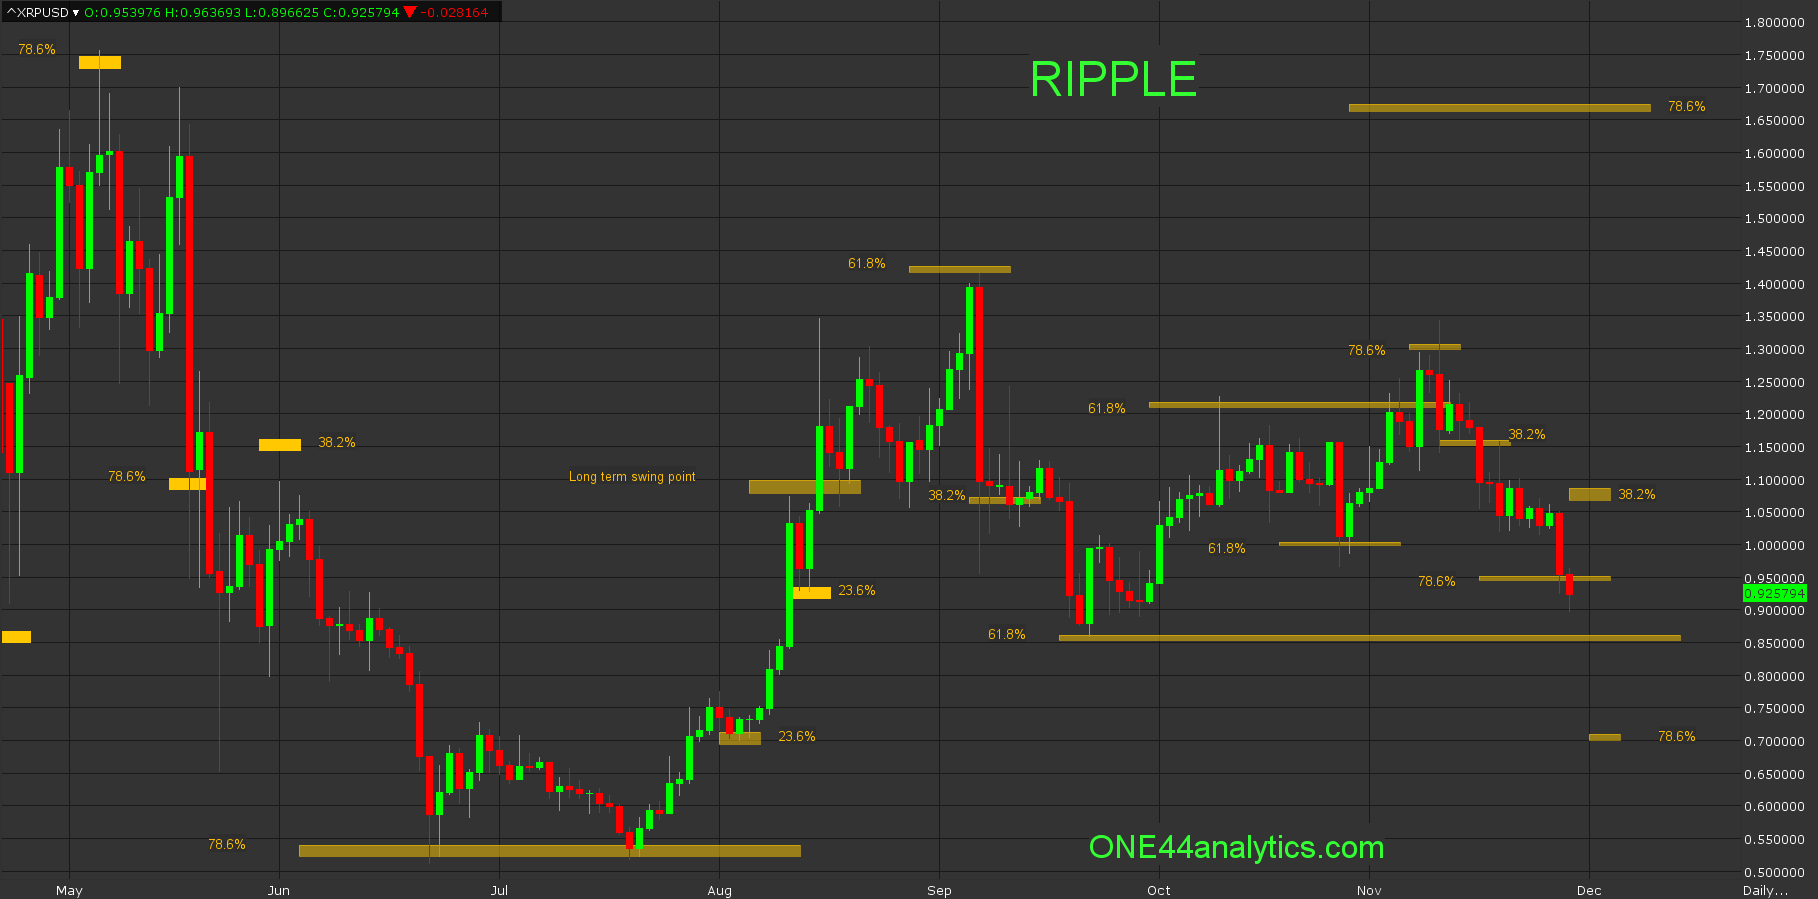
Ripple
The high on 11/10/21 had hit 78.6% at 1.29 and following the ONE44 78.6% rule we know to look for 78.6% the other way and this was 0.95. This has been achieved, with a close back above 0.95 look for 78.6% back up at 1.25. You will have to watch 38.2% of the recent break at 1.07, a failure to get above here keeps the short term trend negative and you can look for 0.86, this is 61.8% of the June low and Sept. high. Below there, look for 78.6% of the same move at 0.71.
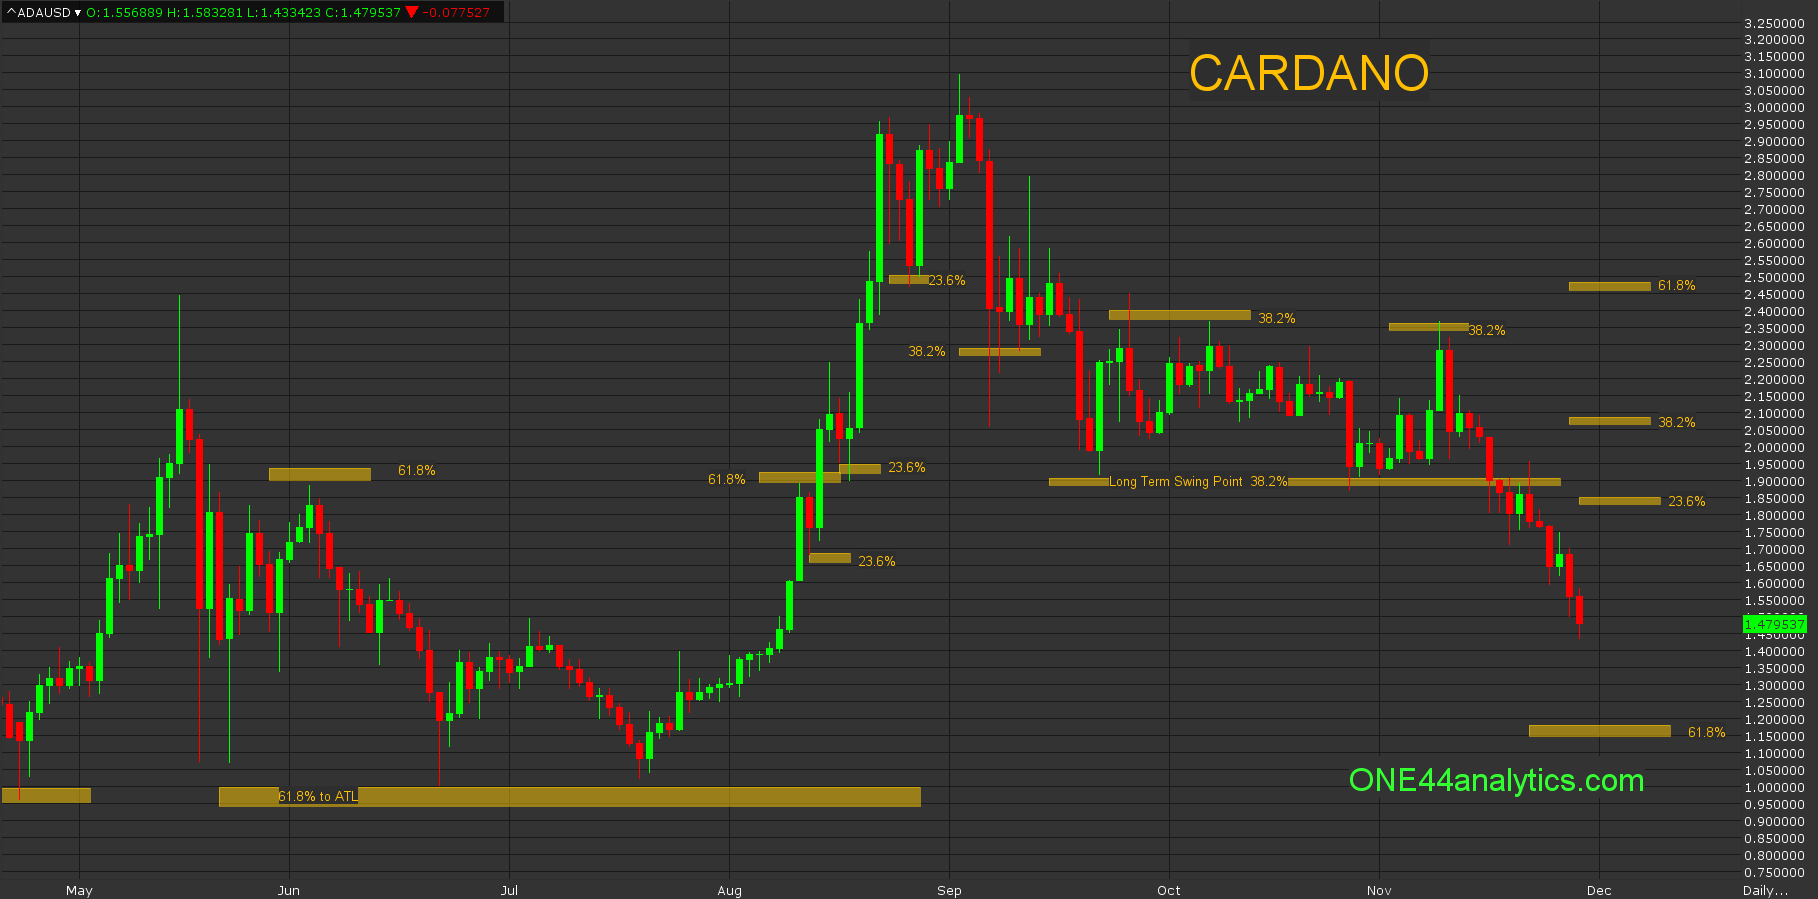
Cardano
As we mentioned in the video, Cardano was stuck between two major 38.2% retracements. Below it was 1.90, this was also our long term swing point and 38.2% back to the high for the year. this was 2.35. It is never good to be stopped by a 38.2% of a smaller range when coming from 38.2% of a much larger range. The break from 235.00 took it through the long term swing point and that gave us a new target of 61.8% at 1.18. Following the 38.2% rule, any rally that can't get above it, keeps the trend negative and you can look for new lows for the move, currently that level is 2.06. Any rally that can't get above 23.6% (183.00) keeps the trend extremely negative.
Sign up for our Free newsletter here.
FULL RISK DISCLOSURE: Futures trading contains substantial risk and is not for every investor. An investor could potentially lose all or more than the initial investment. Commission Rule 4.41(b)(1)(I) hypothetical or simulated performance results have certain inherent limitations. Unlike an actual performance record, simulated results do not represent actual trading. Also, since the trades have not actually been executed, the results may have under- or over-compensated for the impact, if any, of certain market factors, such as lack of liquidity. Simulated trading programs in general are also subject to the fact that they are designed with the benefit of hindsight. No representation is being made that any account will or is likely to achieve profits or losses similar to those shown. Past performance is not necessarily indicative of future results.