DCE January Soy Meal Upside Target

ONE44 Analytics where the analysis is concise and to the point
Our goal is to not only give you actionable information, but to help you understand why we think this is happening based on pure price analysis with Fibonacci retracements, that we believe are the underlying structure of all markets and Gann squares.
Charts are courtesy of Barchart.com
DCE Soy Meal
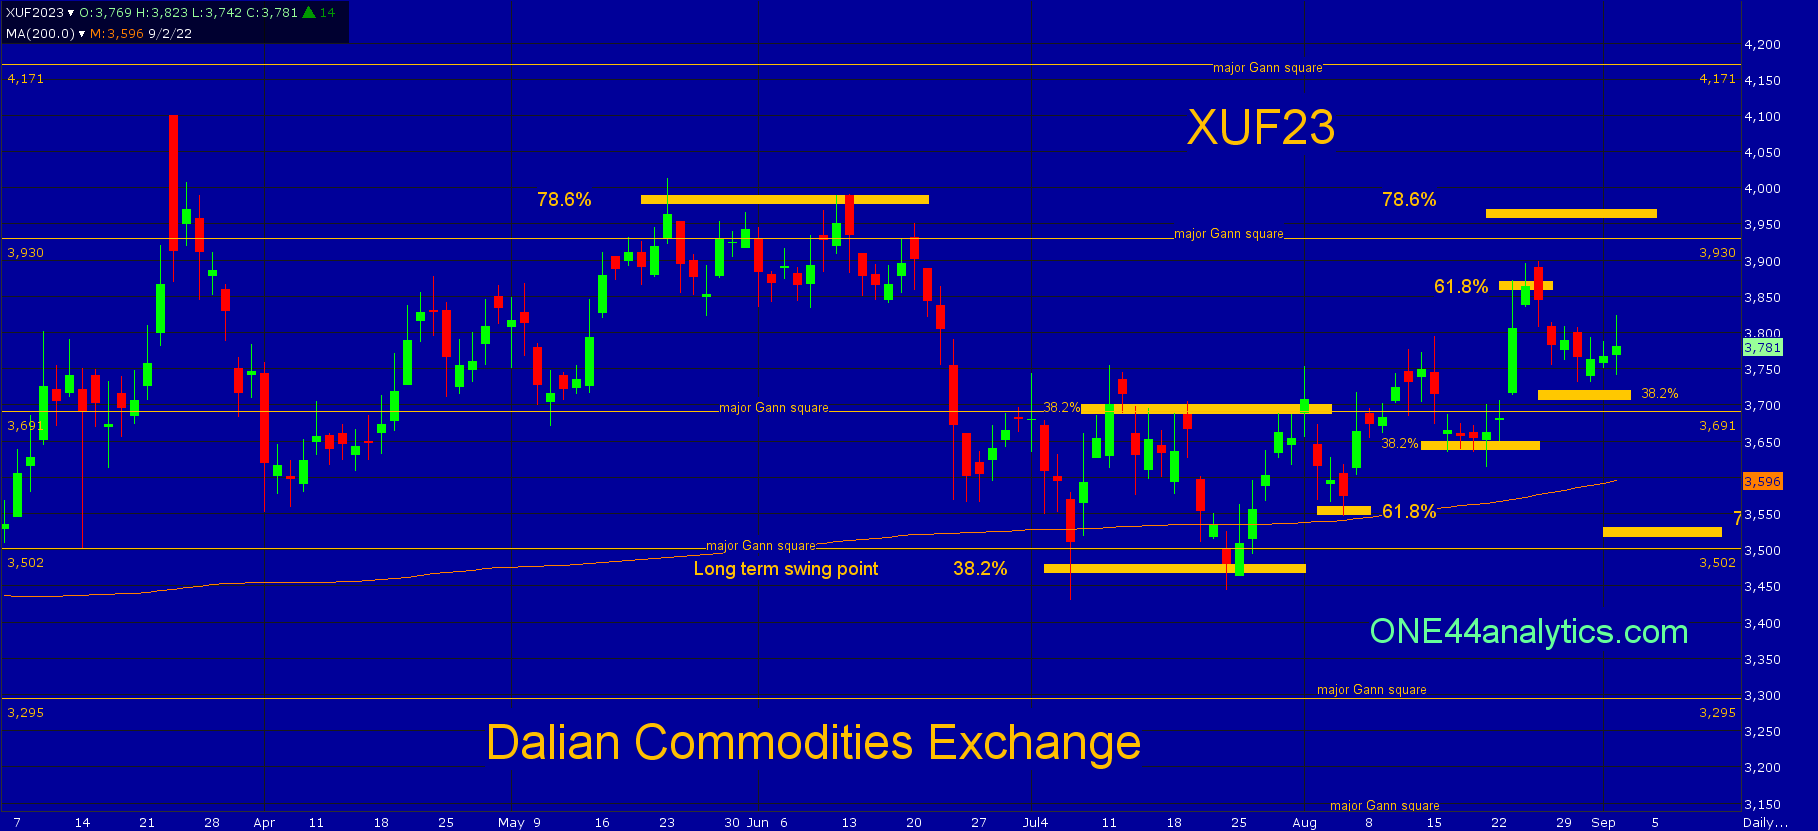
The low on 7/6/22 held the long term swing point of 3,480, this was 38.2% of the contract high on 3/23/22 and the 2020 low. Following the ONE44 38.2% rule,
"Golden Rule". This rule being, " any market that is going to keep its current trend must hold 38.2%". As long as it does the trend will continue and it should make new highs/lows from that retracement.
As long as this level holds, the long term target is new highs for the year.
The first rally from there went 38.2% back to the contract high on 7/11/22, this also lined up with the 3,691 major Gann square and it tested the low again on 7/22/22. Whenever a market fails to make a new low after hitting 38.2% above, we then look for 61.8% of that same move on the next move higher and this is 3,860. This was achieved on 8/23/22, however before then it held two other retracements below before getting there. The first was 61.8% on 8/4/22 and the second was 38.2% on 8/16/22. As you can see on the rally from the long term swing point the setbacks have been getting smaller and holding tighter retracements.
It currently is holding just above 38.2% again, this time at 3,720. Above this level we are looking for the area of the 3,930 major Gann square and 78.6% back to the contract high at 3,960. On a failure to hold 3,720 the target below is 78.6% of the rally at 3,530.
If you like this kind of analysis and trade the U.S. Grains, give us a look Grains Weekly update.
FULL RISK DISCLOSURE: Futures trading contains substantial risk and is not for every investor. An investor could potentially lose all or more than the initial investment. Commission Rule 4.41(b)(1)(I) hypothetical or simulated performance results have certain inherent limitations. Unlike an actual performance record, simulated results do not represent actual trading. Also, since the trades have not actually been executed, the results may have under- or over-compensated for the impact, if any, of certain market factors, such as lack of liquidity. Simulated trading programs in general are also subject to the fact that they are designed with the benefit of hindsight. No representation is being made that any account will or is likely to achieve profits or losses similar to those shown. Past performance is not necessarily indicative of future results.