DCE No. 1 Soybeans and Fibonacci

ONE44 Analytics where the analysis is concise and to the point
Our goal is to not only give you actionable information, but to help you understand why we think this is happening based on pure price analysis with Fibonacci retracements, that we believe are the underlying structure of all markets and Gann squares.
DCE No. 1 Soybeans
Following the ONE44 Fibonacci rules and guidelines we will show you what has happened over the last 3 months and what to look for going forward.
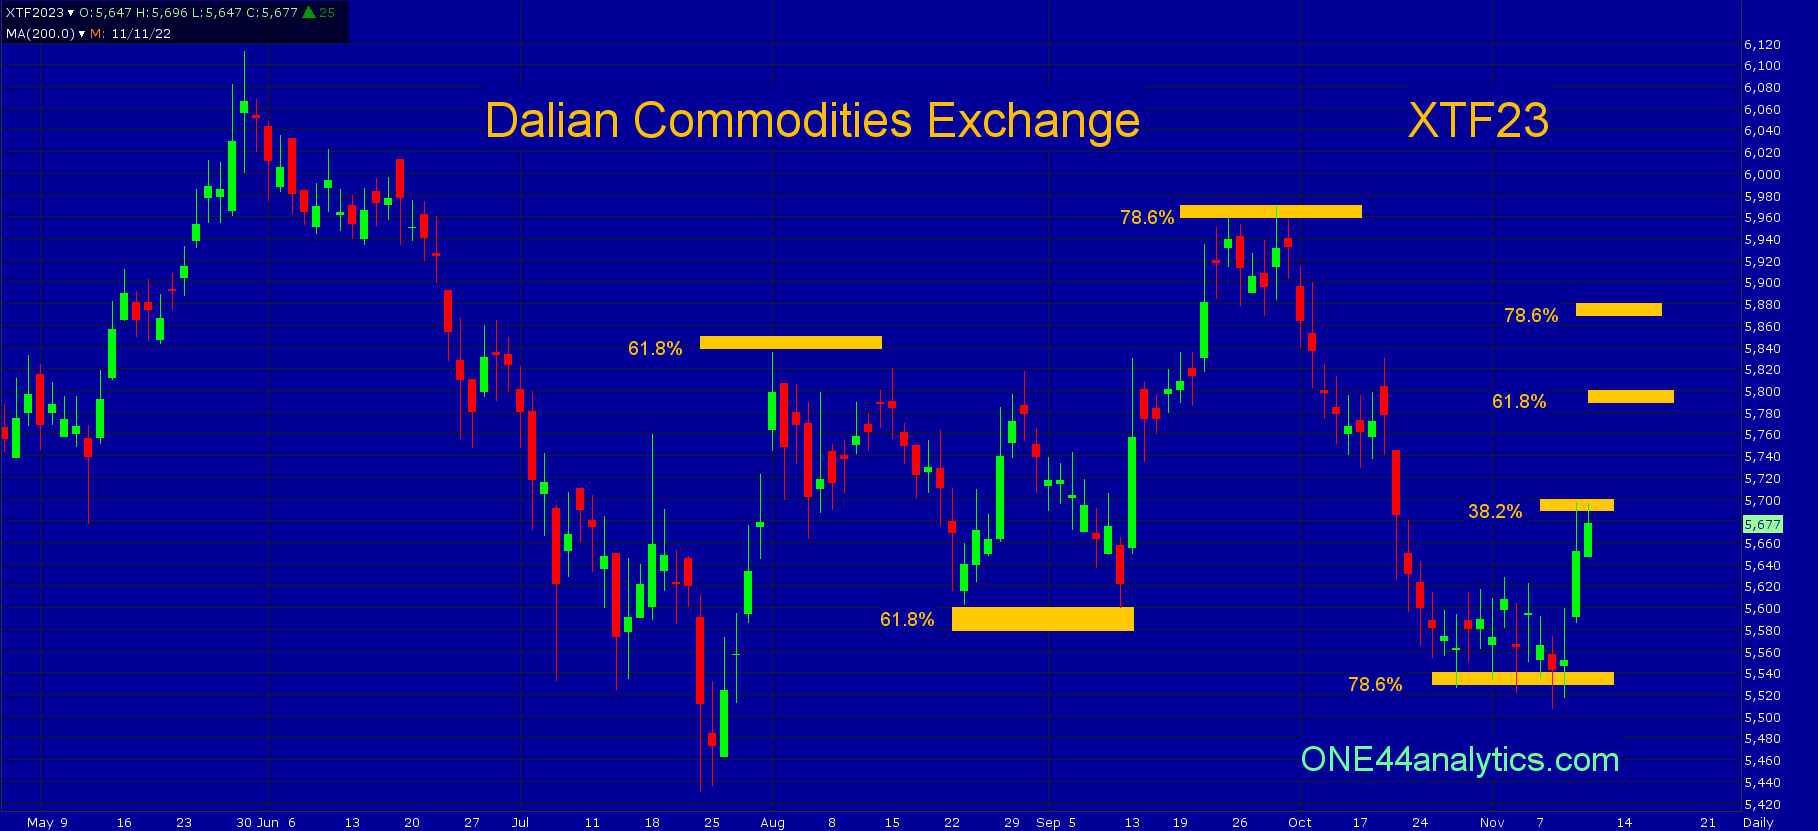
The high on 8/1/22 was 10 cents short of 61.8% back to the 5/30/22 high, using the ONE44 61.8% rule,
Whenever the market holds 61.8% of a move, look for it to go 61.8% of where it just came from. This usually happens when a market is directionless, or in a consolidation period.
We were looking for 61.8% the other way and this was achieved on 8/23/22 and then again on 9/9/22 before going on to 78.6% on 9/23/22. You can also see on the chart how the 61.8% levels caused a consolidation period for a month and a half.
The high on 9/23/22 and then again on 9/29/22 hit 78.6% of the 5/30/22 high and 7/22/22 low, this level was 5960.00. Using the ONE44 78.6% rule,
Any market that hits 78.6% should go 78.6% back the other way. This is also where a lot of Bull markets end and start.
We were looking for 78.6% the other way and this was achieved on 10/27/22 at 5540.00, it also did end the Bull run that had started on 7/22/22.
Now,
Following the 78.6% rule, our long term target is 78.6% the other way at 5870.00 and as always we watch all the retracements on every move to see just how strong, or weak the market is. Right now it hit 38.2% on 11/10/22, if this is all it can rally, look for new lows, or at least a good test of the previous low. Provided it can take out 4670.00 (38.2%) we will then look for the longer term target of 78.6% at 5870.00.
If you like this type of analysis and trade the Grain's take a look at our “Weekly Grain update” Premium Membership on our website. As mentioned above our other way of analyzing the market is with W. D. Gann's "Law of Vibration".
You can also follow us on YouTube for more examples of how to use the Fibonacci retracements with the ONE44 rules and guidelines.
FULL RISK DISCLOSURE: Futures trading contains substantial risk and is not for every investor. An investor could potentially lose all or more than the initial investment. Commission Rule 4.41(b)(1)(I) hypothetical or simulated performance results have certain inherent limitations. Unlike an actual performance record, simulated results do not represent actual trading. Also, since the trades have not actually been executed, the results may have under- or over-compensated for the impact, if any, of certain market factors, such as lack of liquidity. Simulated trading programs in general are also subject to the fact that they are designed with the benefit of hindsight. No representation is being made that any account will or is likely to achieve profits or losses similar to those shown. Past performance is not necessarily indicative of future results.