DCE Soy Meal hits the 4171.00 major Gann square again

ONE44 Analytics where the analysis is concise and to the point
Our goal is to not only give you actionable information, but to help you understand why we think this is happening based on pure price analysis with Fibonacci retracements, that we believe are the underlying structure of all markets and Gann squares.
DCE Soy Meal
This is an update to a post on 10/2/22, "DCE Soy Meal 4171.00 target hit."
From 10/2/22,
Now,
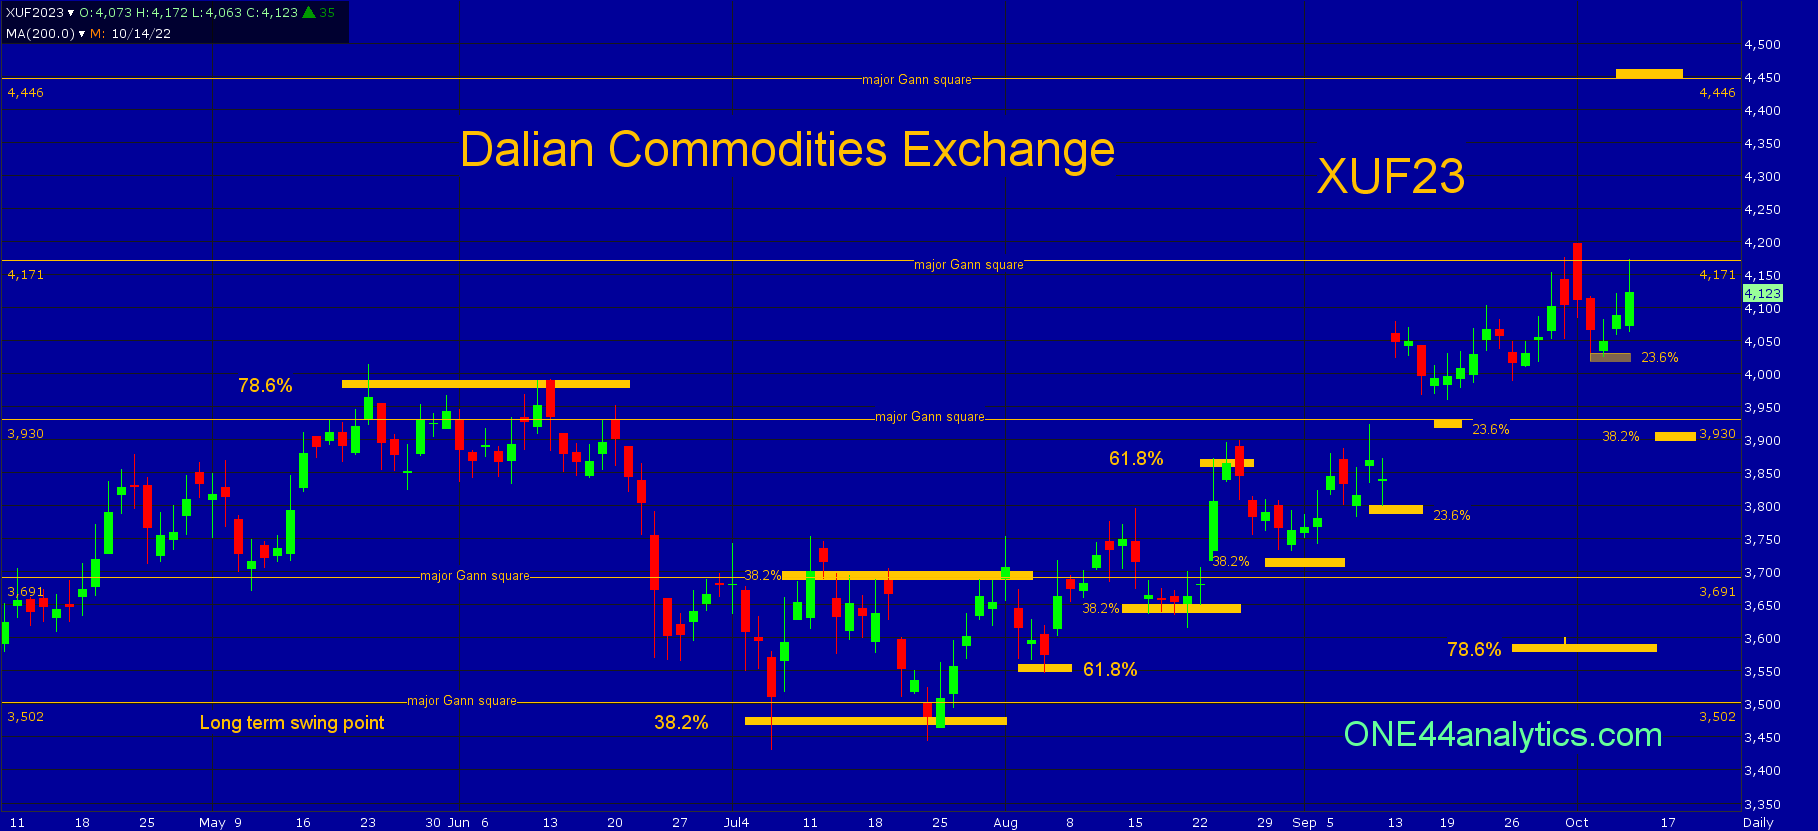
The market held above 3930.00 and they did go for new highs and hit the 4171.00 major Gann square target on Friday.
With the new high for the year, the long term swing point has now moved up to 3530.00.
On a break from the 4171.00 major Gann square, look for the area of 3930.00 and 3913.00, this is first a major Gann square and second, it is 38.2% back to the last time the market hit the long term swing point back in July.
Any setback from 4171.00 that does not get below 23.6% at 4030.00 keeps the trend extremely positive and you can look for new highs again.
With a solid close above 4171.00 we will look for the long term target and major Gann square at 4446.00.
Now,
As you can see on the chart below, the setback from the 4171.00 major Gann square held the tightest retracement of 23.6% at 4030.00.
The rally from there has yet to make a new high for the move and hit the 4171.00 major Gann square again.
Use 4171.00 as the swing point to start the week.
Below it, since they have already reacted from 23.6% we will be looking for 38.2% of the same move at 3913.00, it also has major Gann square just above it at 3930.00. Holding this area keeps the short term trend very positive and you can look for new highs.
Above 4171.00 look for our long term target at 4446.00, this is the next major Gann square above.
If you like this kind of analysis and trade the U.S. Grains, give us a look Grains Weekly update.
FULL RISK DISCLOSURE: Futures trading contains substantial risk and is not for every investor. An investor could potentially lose all or more than the initial investment. Commission Rule 4.41(b)(1)(I) hypothetical or simulated performance results have certain inherent limitations. Unlike an actual performance record, simulated results do not represent actual trading. Also, since the trades have not actually been executed, the results may have under- or over-compensated for the impact, if any, of certain market factors, such as lack of liquidity. Simulated trading programs in general are also subject to the fact that they are designed with the benefit of hindsight. No representation is being made that any account will or is likely to achieve profits or losses similar to those shown. Past performance is not necessarily indicative of future results.