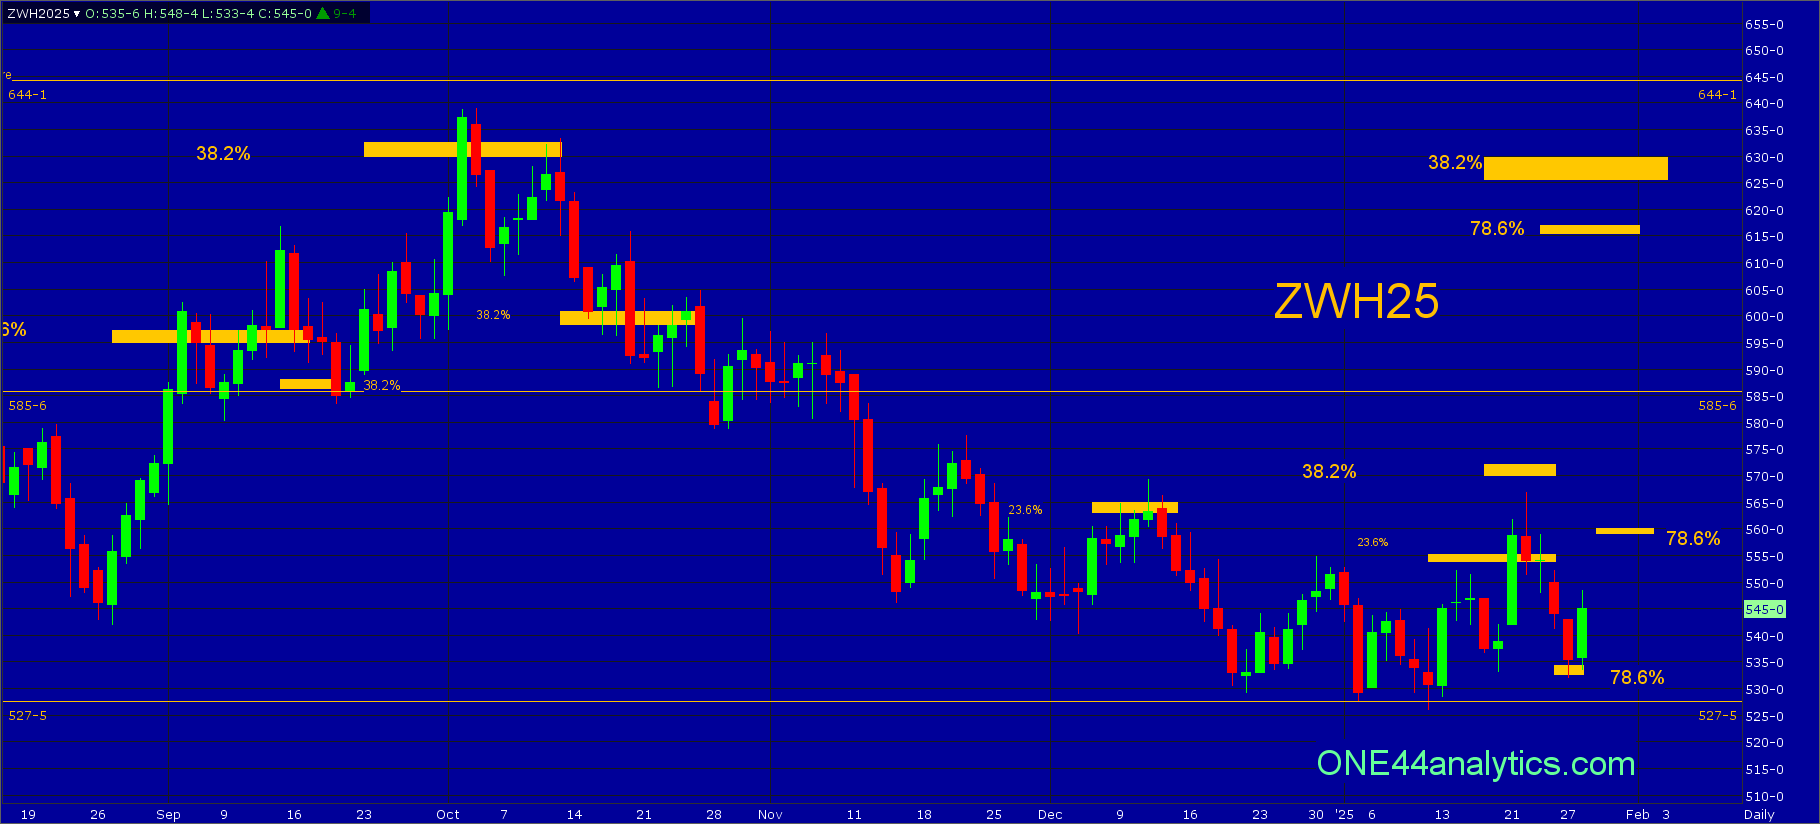
Did Wheat Just bottom at a 78.6% Fibonacci Retracement?

Grains
The charts are key to this analysis.
When a market is in a down trend and there is no current level (Fibonacci retracement/major Gann square) that is telling us to look for a rally, we have to watch the retracements on any setbacks to find the first sign that the trend is changing.
In Soybeans the low on 12/19/24 was not a Fibonacci retracement, or major Gann square. When the market started to rally from that low it hit 38.2% on 12/31/24, it had a couple closes above it and then got right back below it. We were watching the 38.2% level of the current rally at 989.00, it held this level on 1/7/25 (this was the swing point for the week) and it then went on to a new high for the leg up and that was the first sign that the trend was changing. The second sign was when it again held the new 38.2% retracement at 1019.00 on 1/17/25 (swing point for the week). It again went on to a new high. We are currently using 23.6% at 1045.00 as the swing point for this week.

In Corn the change in trend came on 10/17/24 when it failed to make a new low in the area of a 78.6% retracement. We know following the ONE44 78.6% rule that this is where a lot of bull markets start and end. The first target when holding 78.6% is to look for 78.6% the other way and that happened on 11/8/24 at 444.00. The market got the new trend going when it held 38.2% at 437.00 on 12/19/24, it has rallied 50 cents since then. The current target is the area of 61.8% back to the contract high at 508.00 and the 512.25 major Gann square.

This brings us to Wheat, after failing to get above 38.2% at 570.00 on 1/22/25 a new low was the longer term target, however it held the short term target of 78.6% back to the 1/10/25 low at 534.00. Like Corn, a failure to make a new low in the area of a 78.6% retracement can be the start of the next bull move, or at least send it 78.6% of where it just came from. Provided the 534.00 level holds, the first target is 559.00 (78.6%) and we will now see if this is the bottom that turns into a longer term low, just like it did in Corn. When and if this market takes out 559.00 we will then watch the retracements below to see if the trend can continue as it did in both Soybeans and Corn. The short term target for May is 572.00 (78.6%).