Dow Top?
ONE44 Analytics where the analysis is concise and to the point
Our goal is to not only give you actionable information, but to help you understand why we think this is happening based on pure price analysis with Fibonacci retracements, that we believe are the underlying structure of all markets and Gann squares.
For the ONE44 Fibonacci rules and guidelines to help with this article, go here.
Charts are courtesy of Barchart.com
We will get to why this can be a top in the Dow after we show you where it's been.
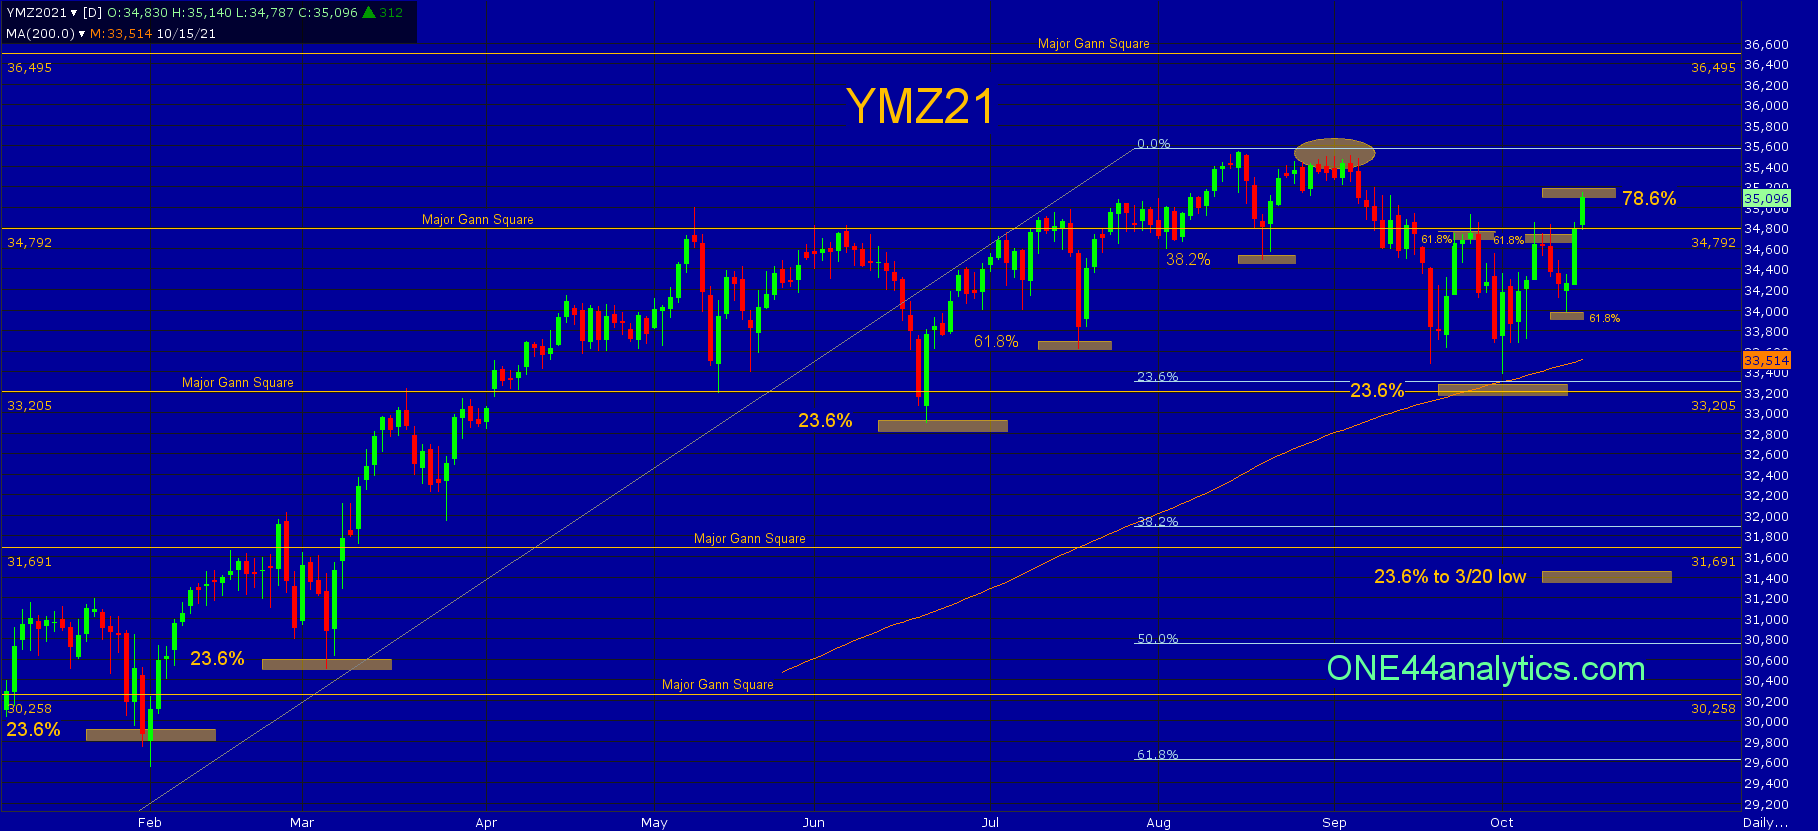
This market has had such a strong move up that in order to get it to come into some retracements we had to use the next most important low above the 3/23/20 and this was the low on 10/30/20. The first good setback happened on 2/1/21, it traded below 23.6%, but the close was well above it and new highs followed. The second setback on 3/4/21 also held 23.6% and went on to new highs. That high hit the 34,792 major Gann square and the break from it hit the 33,205 major Gann square. The rally from there took it back to the 34,792 major Gann square, before going back to the 33,205 major Gann square again and down to 23.6% of the 10/30/20 low on 6/21/21. The rally from there hit the 34,792 major Gann square and the break from it hit 61.8% back to the low on 6/21/21 on 7/19/21. After the new ATH was the first sign of a short term trend change when it held 38.2% on 8/19/21 and failed to make a new high (shaded area). Following the ONE44 Fibonacci rules and guidelines we know that when it fails to make a new high after holding 38.2% we should look for 61.8% of the same move. This was 33,940, it did this and more, however it held above 23.6% going back to the 10/30/20 low. The rally from the low on 9/20/21 hit 61.8% on 9/27/21 and that took it to new lows. The low on 10/1/21 held above 23.6%, the 200 day moving average and the 33,205 major Gann square, keeping the long term trend extremely positive. The rally from there went to 61.8% on 10/7/21 and then down to 61.8% of that rally on 10/13/21. This rally has taken it to 78.6% at 35,100.
As we have shown the long term trend remains very strong based on the retracements it has held on all the setbacks, however we watch all the retracements on every move to see just how strong, or weak a market is and this brings us to the 78.6% rule. This is,
"Any market that hits 78.6% should go 78.6% back the other way. This is also where a lot of Bull markets end and start."
On a setback from 35,100 the target will be 78.6% the other way and this is 33,800 and being that this is where a lot of Bull markets end and start, a break from here longer term can take it down to 23.6% to the 3/23/20 low and this is 31,450, there is also a major Gann square at 31,691. As we mentioned the long term remains very positive and a failure to get a turn lower from the 78.6% level at 35,100 should send it up to the next major Gann square 36,495.
Sign up for our Free newsletter here.
FULL RISK DISCLOSURE: Futures trading contains substantial risk and is not for every investor. An investor could potentially lose all or more than the initial investment. Commission Rule 4.41(b)(1)(I) hypothetical or simulated performance results have certain inherent limitations. Unlike an actual performance record, simulated results do not represent actual trading. Also, since the trades have not actually been executed, the results may have under- or over-compensated for the impact, if any, of certain market factors, such as lack of liquidity. Simulated trading programs in general are also subject to the fact that they are designed with the benefit of hindsight. No representation is being made that any account will or is likely to achieve profits or losses similar to those shown. Past performance is not necessarily indicative of future results.