Ethereum, above the long term swing point, Bitcoin well below it

Bitcoin
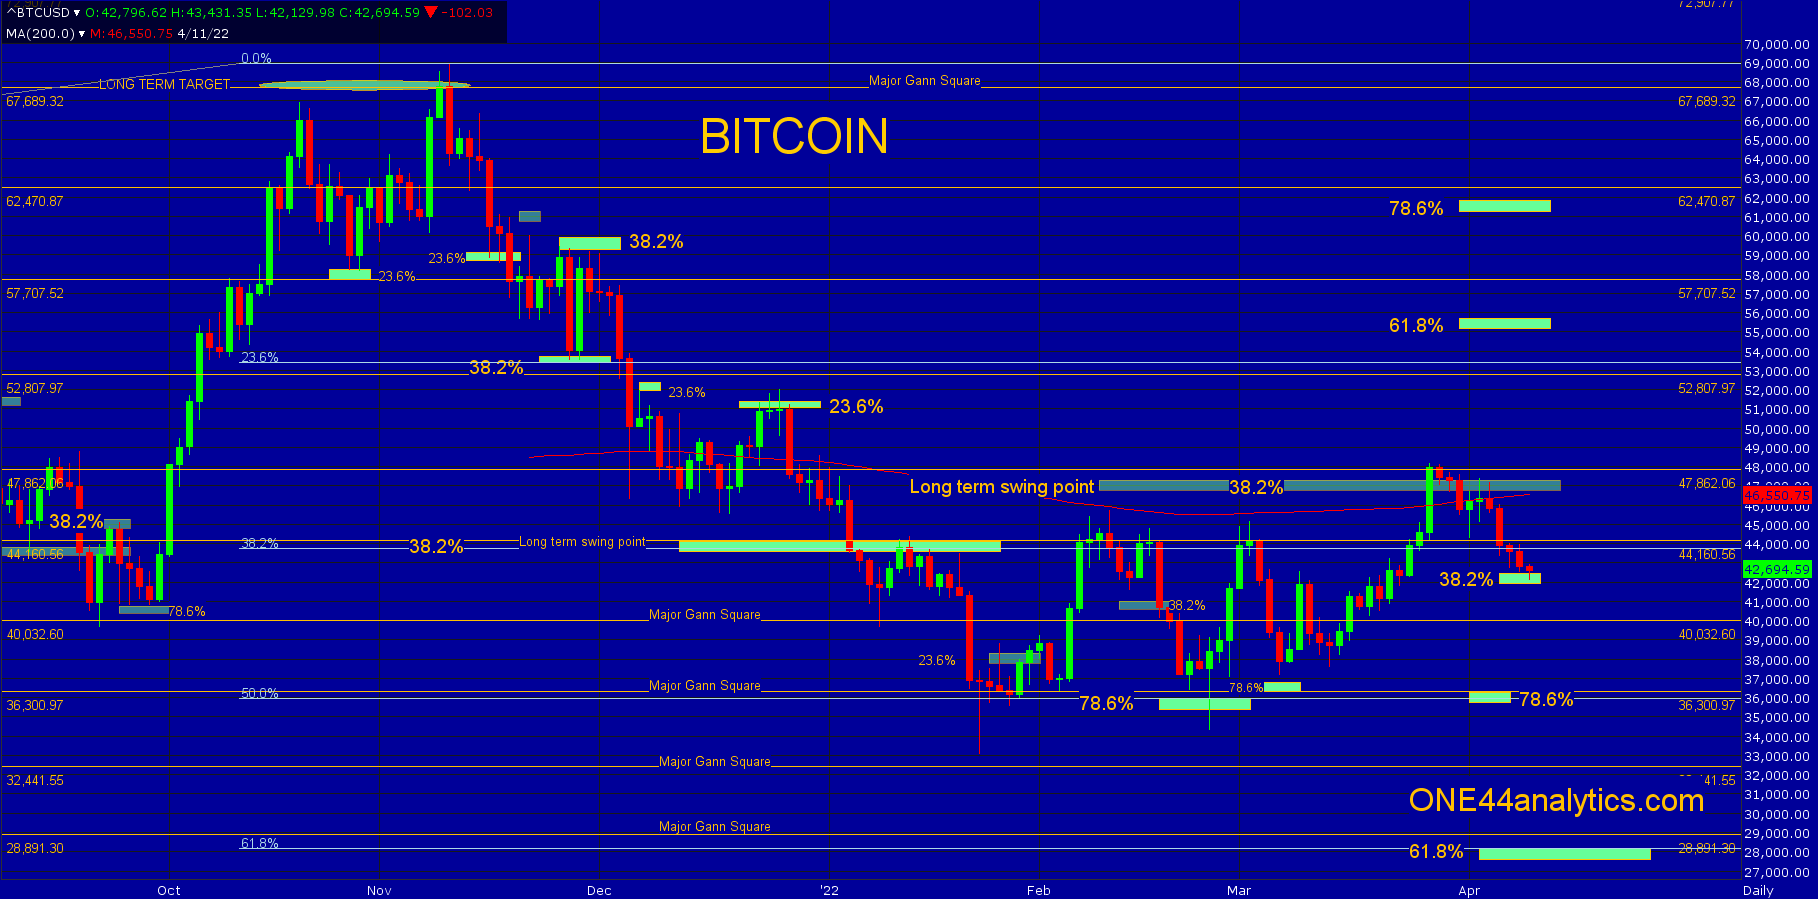
It did not last long above the long term swing point of 46,800 and could not get above the 47,862 major Gann square and is now back below the 200 day average and at 38.2% of the rally back at 42,500. Even by getting back below the long term swing point, holding 38.2% at 42,500 would be a very positive sign, however a failure to hold this level should send it to 78.6% at 36,300, this is also a major Gann square. Taking out the long term swing point should send it to 61.8% back to the ATH at 55,130. The long term downside target is still 28,000, this is 61.8% of the ATH and 2018 low.

Ethereum
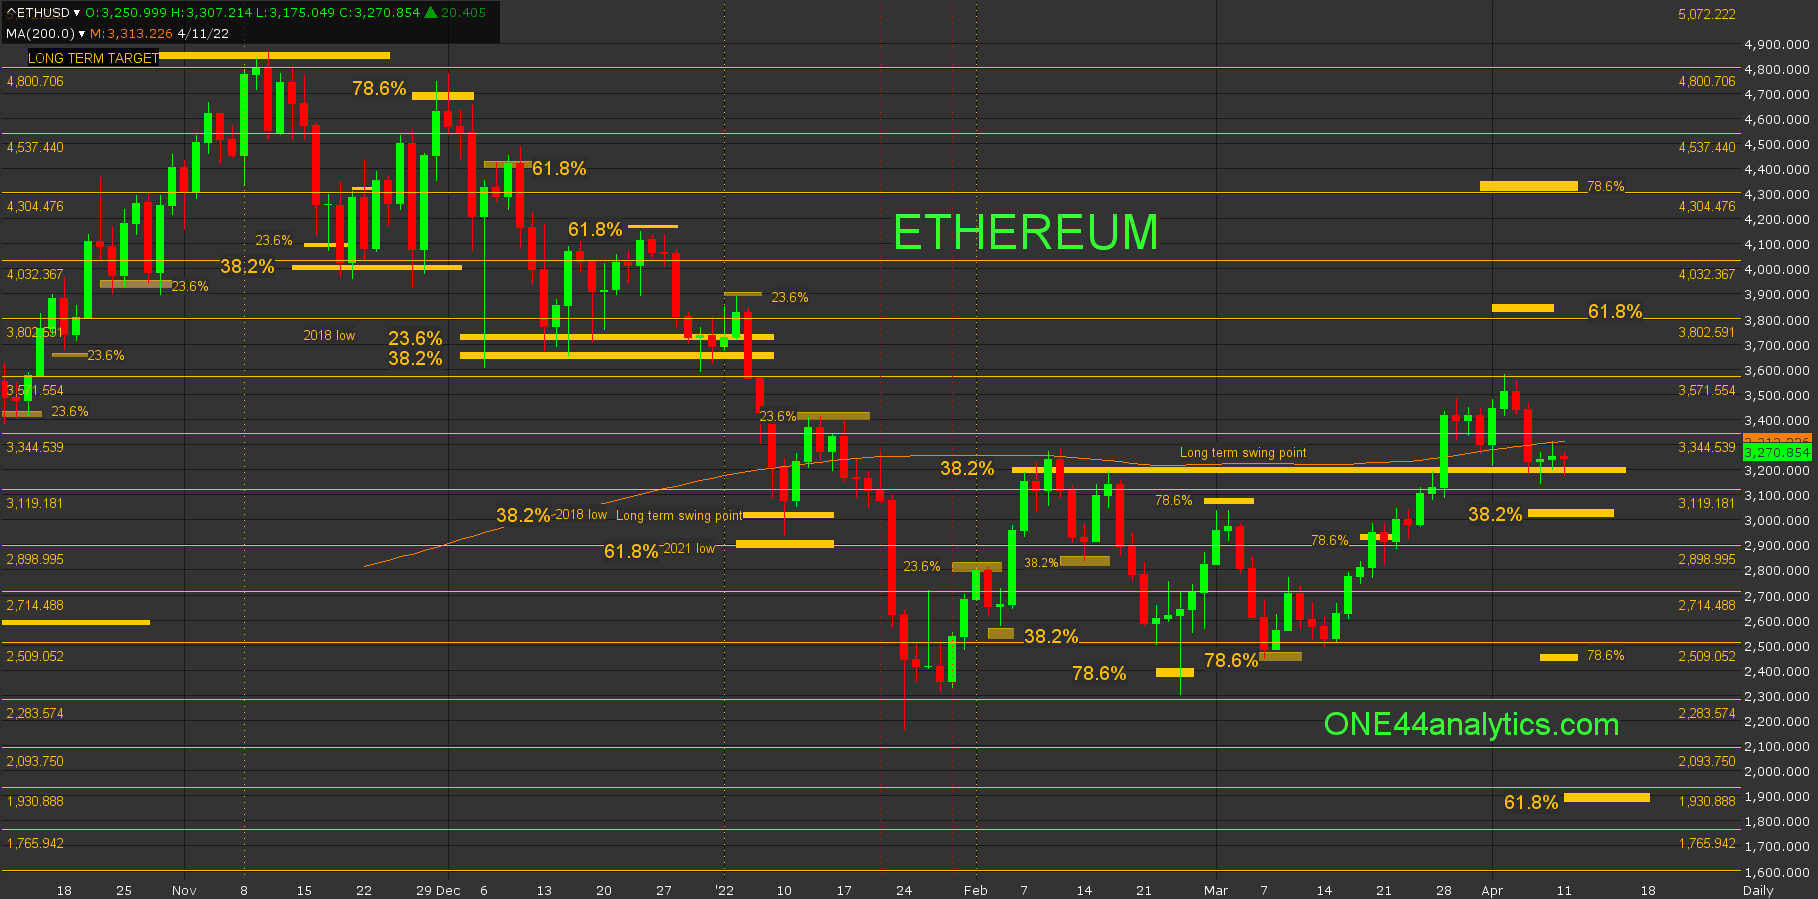
The high after getting above the long term swing point hit the 3571.00 major Gann square, the setback from it has it right back on the long term swing point of 3190.00. Even with a close back below it, it would have to take out 38.2% of the current rally at 3040.00 to turn the short and long term trend negative. Provided it did, look for 78.6% at 2470.00, before then are a few major Gann squares at 2892.00, 2714.00 and 2509.00 to look for support. Above the long term swing point look for 61.8% back to the ATH at 3825.00, there is also a major Gann square in the area at 3802.00.

You can get all the Gann Law of Vibration charts for Bitcoin, Ethereum, Litecoin, Solana, Cardano, Ripple and Dogecoin HERE These charts are very useful for short term support and resistance.
(LTCUSD) (ADAUSD) (SOLUSD) (DOGEUSD) (XRPUSD)
Sign up for our Free newsletter here.
