Ethereum/Bitcoin
ONE44 Analytics where the analysis is concise and to the point
Our goal is to not only give you actionable information, but to help you understand why we think this is happening based on pure price analysis with Fibonacci retracements and Gann squares.
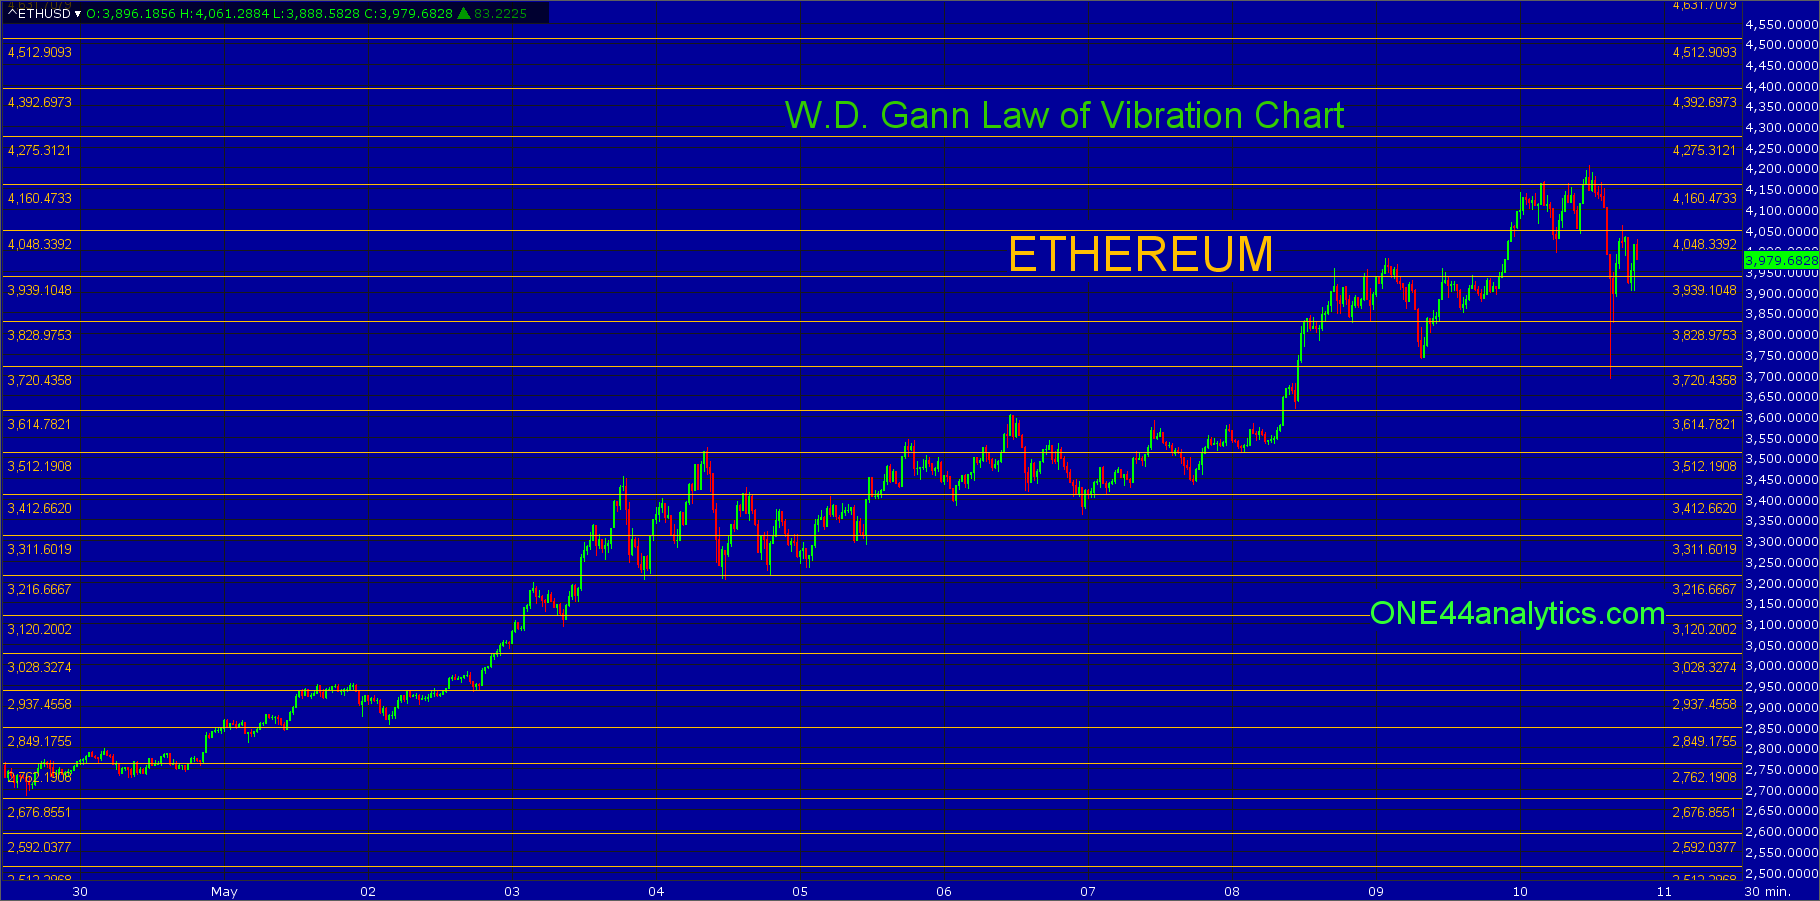
ETHEREUM
To start off, every setback in the meteoric rise of Ethereum has held the key retracements to keep the trend intact. Starting with the 3/1/21 low that was 38.2% (1306.00) back to the 2018 low Followed by the low on 4/19/21 that was 23.6% back to the 2018 low and 38.2% back to the 3/1/21 low.
Today's new high moves all the support levels up. The long term swing point is now at 2650.00, this is 38.2% to the 2018 low and using the ONE44 Fibonacci rules and guidelines we know this is the level that must hold to keep the trend intact. With this move being such a big move up, we will now watch some of the retracements from other key levels and these are the two previously mentioned lows on 3/1/21 and 4/19/21. The one that keeps the market extremely positive is 23.6% back to the 4/19/21 low, this is 3696.00, The next most important level is 3544.00, this is 23.6% back to the 3/1/21 low
On a bigger setback from any high, watch 23.6% back to the 2018 low, currently this is 3250.00.
Our next long term target is a major Gann square up at 4410.00 and if this level is taken out look for 5320.00.
BITCOIN
Bitcoin continues to trade against the 57700 swing point. The last three days have traded above it, but the closes have been below. This level is both a major Gann square and 61.8% back to the ATH. On a break from this area look for 23.6% back to the 2018 low, this is 50900. On a failure to hold this level look for the long term swing point at 42200, this is 38.2% back to the 2018 and key to the long term trend.
Once they can get a solid close above 57700 look for the long term target at 67700.
On both the Ethereum and Bitcoin charts you can use the major Gann squares as support and resistance, they are marked by the yellow horizontal lines.
The second set of charts are Gann squares on an Hourly basis and can be used as short term support and resistance.
You can find the short term Gann square charts on Litecoin, Ripple and Dogecoin on our website as well.
You can get all the rules and guidelines to the Fibonacci retracements on our website.
Sign up for our Free newsletter here.