Ethereum, up, or down it's all about Fibonacci
ONE44 Analytics where the analysis is concise and to the point
Our goal is to not only give you actionable information, but to help you understand why we think this is happening based on pure price analysis with Fibonacci retracements, that we believe are the underlying structure of all markets and Gann squares.
For the ONE44 Fibonacci rules and guidelines to help with this article, go here.
Charts are courtesy of Barchart.com
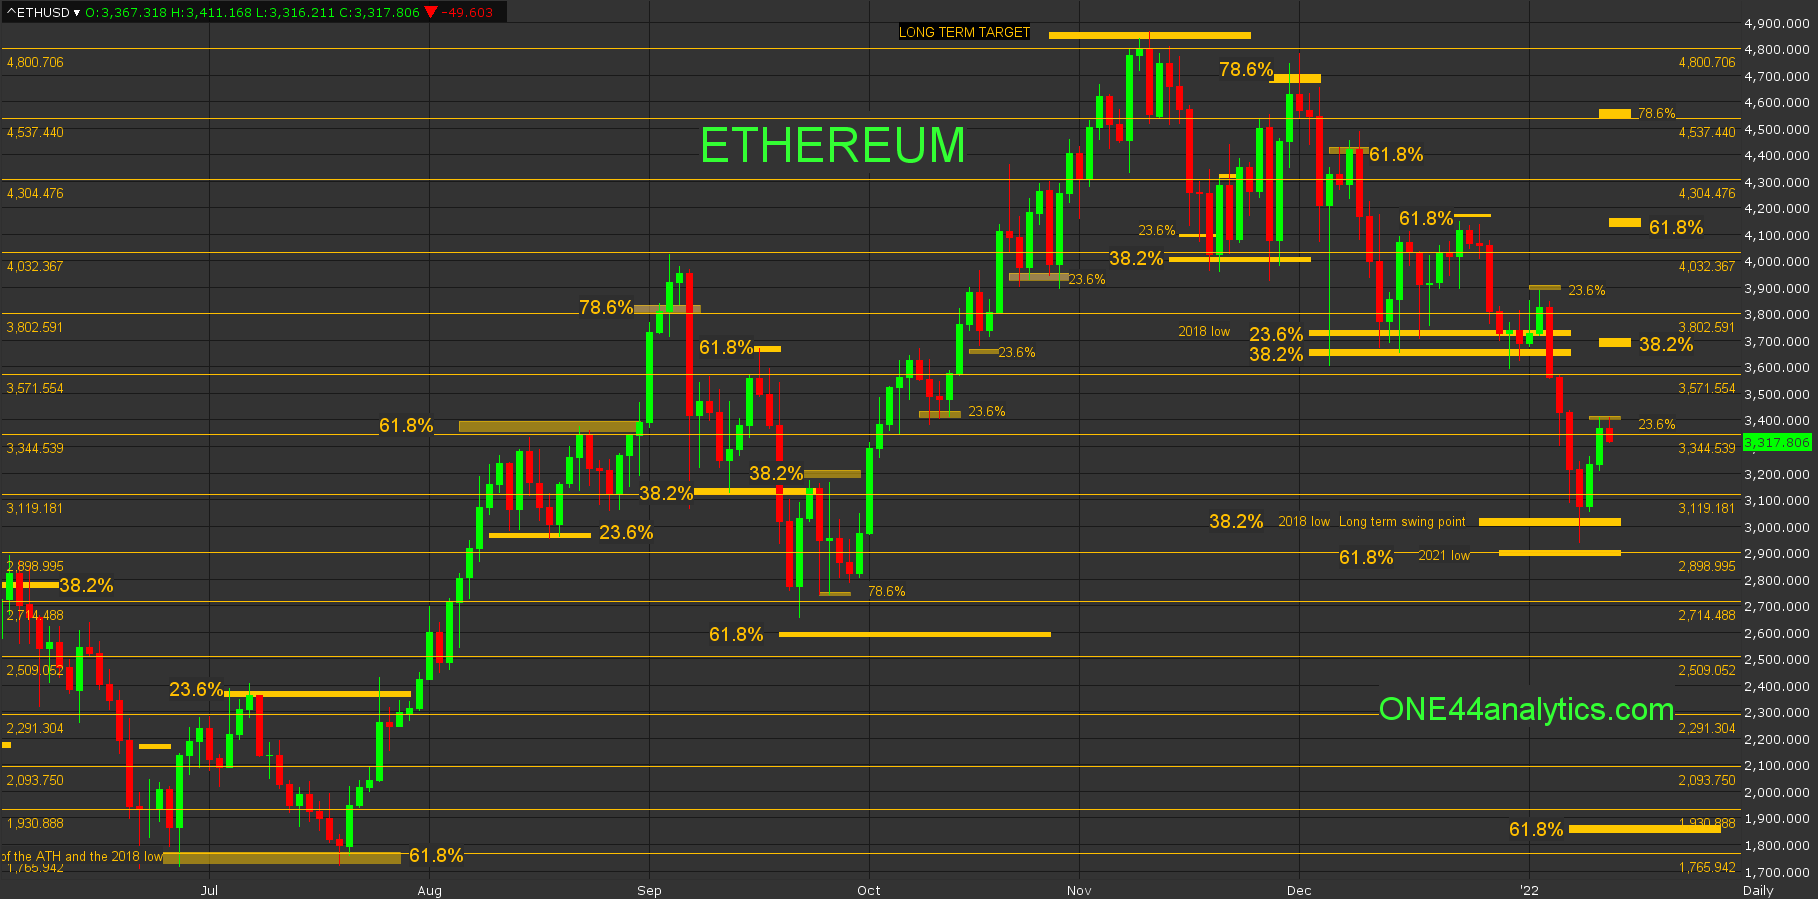
Ethereum
We had posted months in advance the long term targets for both Ethereum. 4850.00 and Bitcoin 67,700 and in a post on 11/16/21 we said
"The long term target above has a good chance of making this a bigger break than we have seen lately and if so, there are two key areas to watch for. The first is 53,700 to 52,800, in this area is 38.2% back to the 6/22/21 low, 23.6% back to the 2018 low and a major Gann square. The second area is 44,400 to 43,700, the first is 61.8% back to the 6/22/21 low, the second is 38.2% back to the 2018 low and this is the long term swing point, also in between is a major Gann square."
and in. Ethereum
"Like Bitcoin, if this is all they can setback look for a run at the highs again and on a bigger break there are two key areas to watch. The first is 3730.00 to 3652.00, this is 23.6% back to the 2018 low and 38.2% back to the 6/22/21 low. The second area is 3030.00 to 2930.00, the first is 38.2% back to the 2018 low and it is our long term swing point and the second is 61.8% back to the 6/22/21 low."
In Ethereum the setback from 4850.00 took it to 38.2% of the last leg up at 4020.00, being 38.2% it should send it to new highs to keep the trend positive and a failure to do so gives us the first sign of a trend change. It did not make a new high and it hit 78.6% back to the ATH on 11/30/21 and as the second part of the ONE44 Fibonacci 78.6% rule states,
“Any market that hits 78.6% should go 78.6% back the other way. This is also where a lot of Bull markets end and start.”
As you can see, it ended the rally for the time being and the break from there sent it to the first of the two key areas we were looking for on a bigger break from the long term target, this was 3730.00 to 3652.00. The first rally from this area took it to 61.8% back to the ATH on 12/8/21 and the break from it went to retest the key area of 3730.00 to 3652.00. The next rally from this area was only able to get to 61.8% of the high on 12/8/21, this was 4165.00 on 12/23/21, as you can see the rallies from the key area of support are getting less and less, never a good sign. This was made even more evident by the next rally on 1/4/22 that was only able to get back 23.6% before plunging to new lows and our next key support area. The break from 3890.00 took it to 2937.00 in 4 days.
The next key area was 3030.00 to 2930.00, this was first 38.2% back of the ATH and the 2018 low and our long term swing point and secondly 61.8% back to the 6/22/21 low.
We do expect a big rally from this area, with it being the long term swing point. The long term target will be new ATH's, however as always we watch all the retracements on every move to see just how strong, or weak the market is regardless of the long term target. As of right now it has rallied more than 10% from this area and is currently at 23.6% back to the ATH, if this is all they can do look for a retest of the 3030.00. The short term trend will not turn positive until it can take out 38.2% of the break from the ATH, this is 3670.00. Provided they get through there look for 78.6% at 4537.00, this is also a major Gann square.
A failure to hold the long term swing point will give us a new long term target of 61.8% at 1875.00 and the market could spend months in a sideways trading pattern.
If you are looking for option plays to go with the ONE44 levels, we highly recommend going to the Barchart webinar library where John Rowland has plenty of information on Option strategies.
Here is one, Using the Long Strangle Options Strategy for Opportunity Trades
Sign up for our Free newsletter here.
FULL RISK DISCLOSURE: Futures trading contains substantial risk and is not for every investor. An investor could potentially lose all or more than the initial investment. Commission Rule 4.41(b)(1)(I) hypothetical or simulated performance results have certain inherent limitations. Unlike an actual performance record, simulated results do not represent actual trading. Also, since the trades have not actually been executed, the results may have under- or over-compensated for the impact, if any, of certain market factors, such as lack of liquidity. Simulated trading programs in general are also subject to the fact that they are designed with the benefit of hindsight. No representation is being made that any account will or is likely to achieve profits or losses similar to those shown. Past performance is not necessarily indicative of future results.