Ethereum Update
ONE44 Analytics where the analysis is concise and to the point
Ethereum
The swing point remains at 1760.00, this is a major Gann square and 23.6% back to the 1/11/21 low. There is one other major Gann square before our long term target of 2291.00 to look for resistance at 2105.00. With a close below the 1930.00 major Gann square, look for the area of 1618.00 and 1582.00, this a major Gann square, 23.6% back to the 2018 low and 38.2% back to the 1/11/21 low. On a bigger break from any high look for the long term swing point of 1300.00, this is 38.2% back to the 2018 low and a major Gann square.
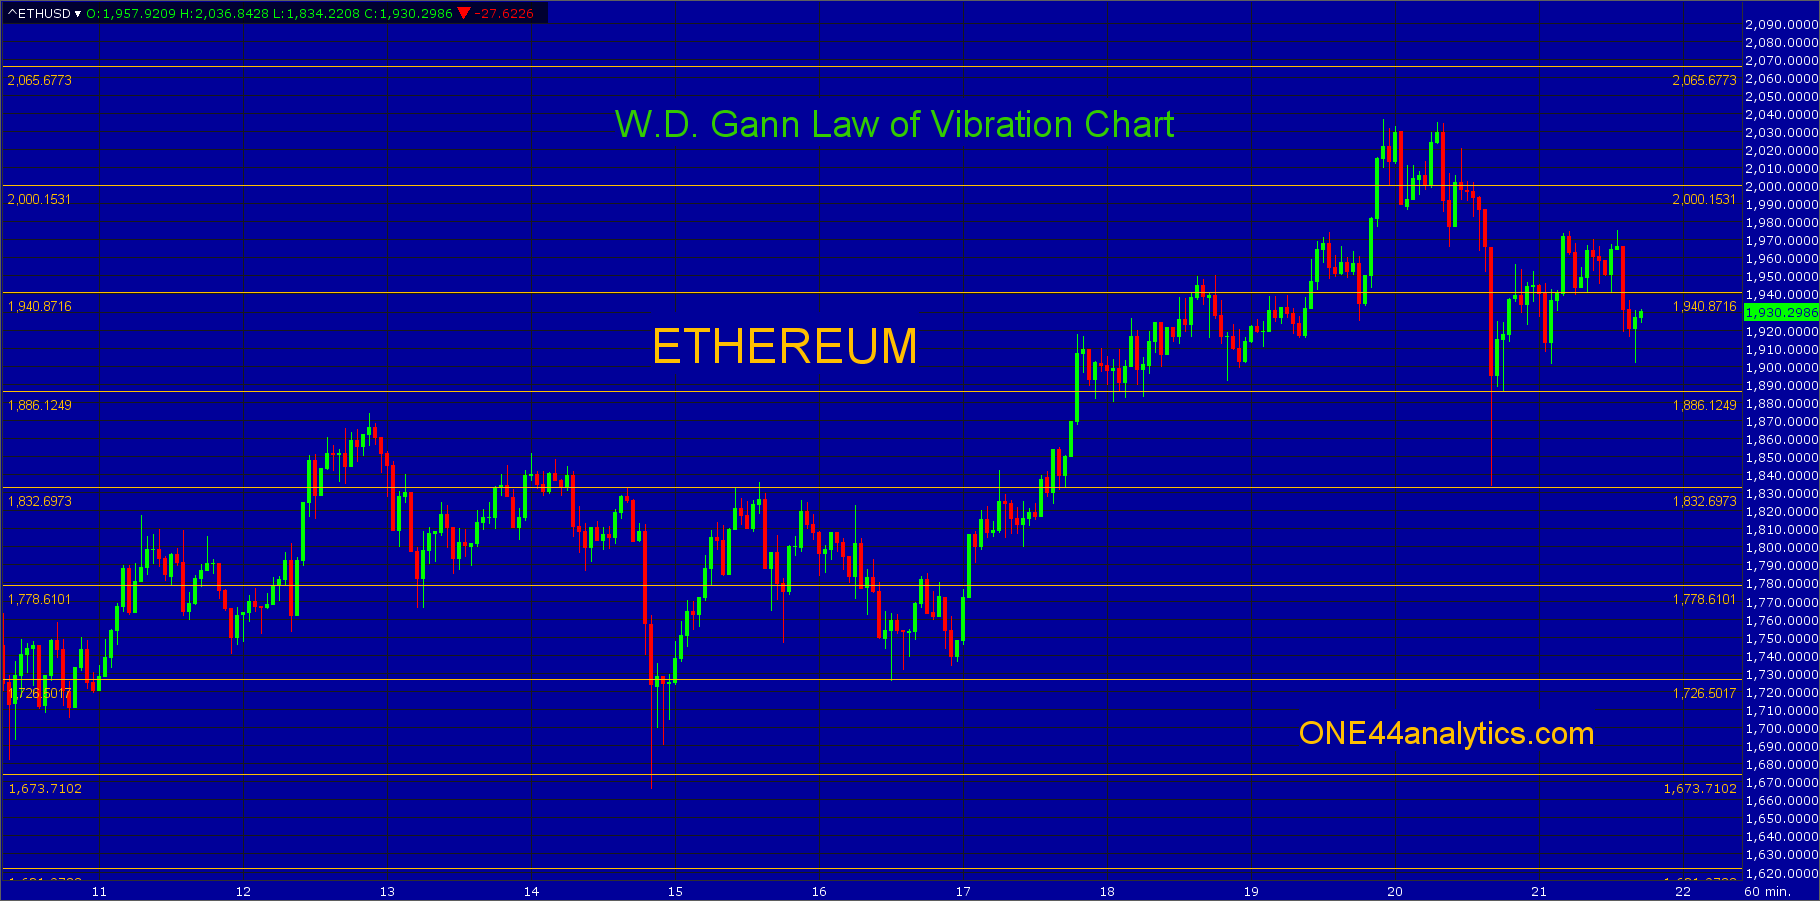
The Second Chart below has natural support and resistance levels that are based on W.D.Gann's "Law of Vibration"
They are marked by the yellow horizontal lines
Each level can be used as support and then resistance once taken out and the reverse when starting as resistance. These levels will be good until the end of each contract.
Our goal is to not only give you actionable information, but to help you understand why we think this is happening based on pure price analysis with Fibonacci retracements and Gann squares.
You can get all the rules and guidelines to the Fibonacci retracements on our website
Sign up for our Free newsletter here.
This is our latest video in an ongoing series of how to use the Fibonacci retracements. Even if you do not trade the market covered the rules and guidelines are the same, as we believe the Fibonacci retracements are the underlying structure of all markets.
In our last video we updated the view on AMD (link below), there has already been a 10% move up in 9 trading days from the actionable information in it.
https://www.youtube.com/watch?v=gSISbkEtQj0&t=143s&ab_channel=ONE44Analytics