Fibonacci chart of the week, Bonds
ONE44 Analytics where the analysis is concise and to the point
Our goal is to not only give you actionable information, but to help you understand why we think this is happening based on pure price analysis with Fibonacci retracements and Gann squares.
You can get all the rules and guidelines to the Fibonacci retracements on our website.
T-Bonds
This is a follow up to the complimentary update of the Fibonacci chart of the week that we did on 2/27/21 where we showed you all of the Fibonacci retracements that it reacted to and what to look for from them. You can view it here.
We ended the last post with,
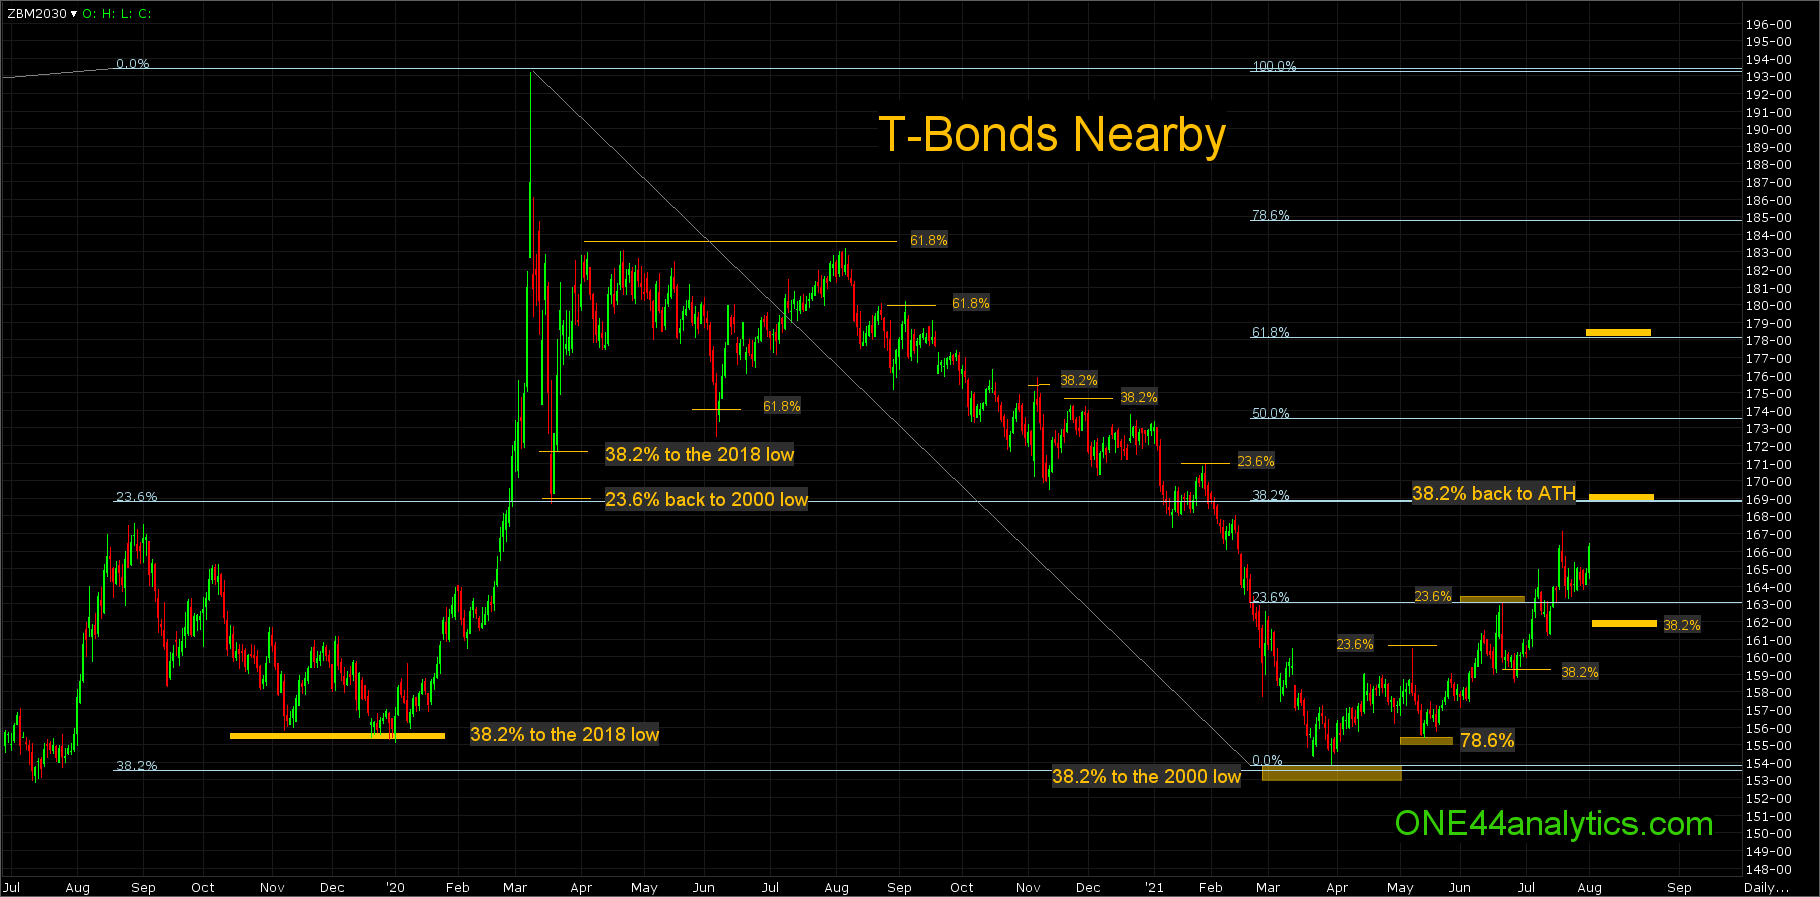
"There is one other area of support to watch if this current low is taken out and this is 153.20 and it is 38.2% back to the 2000 low."
The low on 3/30/21 was 153.29, using the ONE44 Fibonacci rules and guideline the possible upside target would be new highs, however we watch all the retracements regardless of the long term target.
The first rally from 153.29 hit 160.15, this was 23.6% back to the 8/6/20 high, this should have led to new lows, except it held 78.6% of the first rally at 155.15. The 78.6% retracement is one that is always worth watching, as it is the start and end of many bull runs. In this case, we already hit 38.2% back to the 2000 low, so the bigger move from 78.6% was not unexpected. The rally from it hit 163.00, this was 23.6% back to the ATH and the break from there held 38.2% of the current rally from 153.29, this was 159.06. It did have one close below it and this is acceptable, with the close right back above it another rally followed. The two setbacks after this on 7/13/21 and 7/22/21 have held well above 38.2% keeping the short term trend positive.
Currently
It is now approaching 38.2% back to the ATH, this is 168.28. This will be a major test for the market. We know we are being driven up from a much bigger 38.2% retracement at 153.20 and that new highs are possible, however if the market reacts to a smaller 38.2% retracement (168.28) it would be a negative sign for it. The same will be true, if there is a reaction from 168.28 and it holds 38.2% of the smaller run up, it would be a very positive sign.
This rally should continue higher for now until it takes out 38.2% at 162.00, with a target of 168.28. With a solid close above 168.28 the next target becomes 178.05, this is 61.8% back to the ATH.
Reading our previous update on this will give you a better understanding of all the other markings not mentioned on this chart.