Fibonacci, It's Everywhere, Soybean Oil & Meal
ONE44 Analytics where the analysis is concise and to the point
Our goal is to not only give you actionable information, but to help you understand why we think this is happening based on pure price analysis with Fibonacci retracements, that we believe are the underlying structure of all markets and Gann squares.
For the ONE44 Fibonacci rules and guidelines to help with this article, go here.
Charts are courtesy of Barchart.com
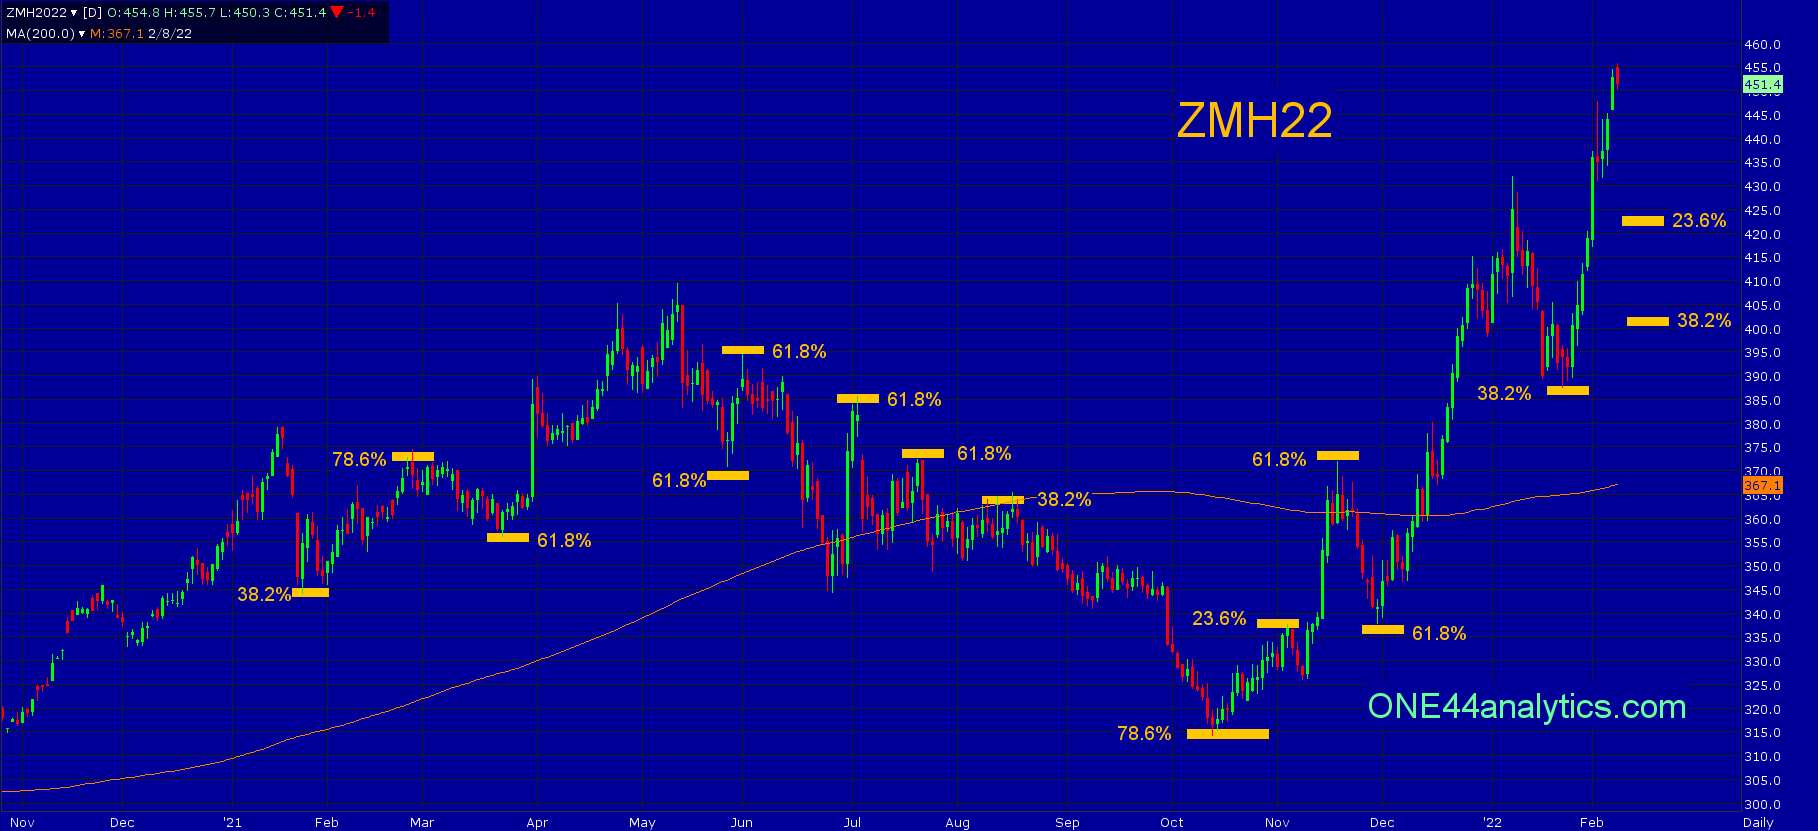
Soybean Meal
To show you just how important the Fibonacci retracements are when using the ONE44 rules and guidelines, we will go back to the first good setback on 1/25/21, this was 38.2% of the contract high and low and what it needed to stay above to keep the trend positive. From here we were looking for new highs for the move, per the 38.2% rule. As always we watch all the retracements on every move to see just how strong, or weak the market is regardless of the longer term target. The rally failed to make a new high and hit 78.6% back to the 1/19/21 high. Two things can happen from a 78.6% retracement, first is, to look for 78.6% retracement the other way and it can also be the end, or start of a Bull run. The setback from it was only able to 61.8% back on 3/23/21 and the expected new high from the previous 38.2% level on 1/25/21 was then achieved.
The setback from the new high on 5/12/21 went through 23.6% of the contract low and held above 38.2% on 5/26/21. It did hit 61.8% back to the 1/25/21 on that same day and as the 61.8% rule states, look for 61.8% the other way when it holds 61.8%, this happened on 6/1/21. The break from there took it through 38.2% of the contract low and this turned the trend negative. The next sharp rally hit 61.8% back to the contract high on 7/2/21, the break from it went 61.8% the other way and more. The rally on 7/21/21 hit 61.8% and the rally on 8/12/21 could only go 38.2%. Just as you saw the market hold the retracements on the way up in the first part of the year, you will also see it stay below them on the way down when the trend turn negative.
The market did not even stop at 61.8% on 9/30/21 and ended up going to 78.6% of the contract high and low on 10/13/21. As the second part of the 78.6% rule states, "this is where a lot of Bull runs start and end". The first rally hit 23.6% on 11/3/21 and failed to make a new low, giving us another indication of a possible rally starting. The rally once it took out 23.6%, blew through 38.2% and went right to 61.8% on 11/17/21. Following the 61.8% rule, we were looking for a 61.8% retracement and this happened on 11/30/21.
On the rally from 61.8% there was not another retracement to look for support until it made a new contract high on 1/7/22. The break from this high hit 38.2% keeping the trend positive and new highs followed as we would have been looking for.
We only marked the key retracements on the chart to keep it as clean as possible for better viewing, we recommend you check all of these retracements on your own charting service to see just how accurate they are.
Our long term target is 490.00 and as long as it stays above 38.2% at 403.00 on any setbacks that target will remain valid. Only being able to get back to 23.6% at 423.00 would keep this market extremely positive.
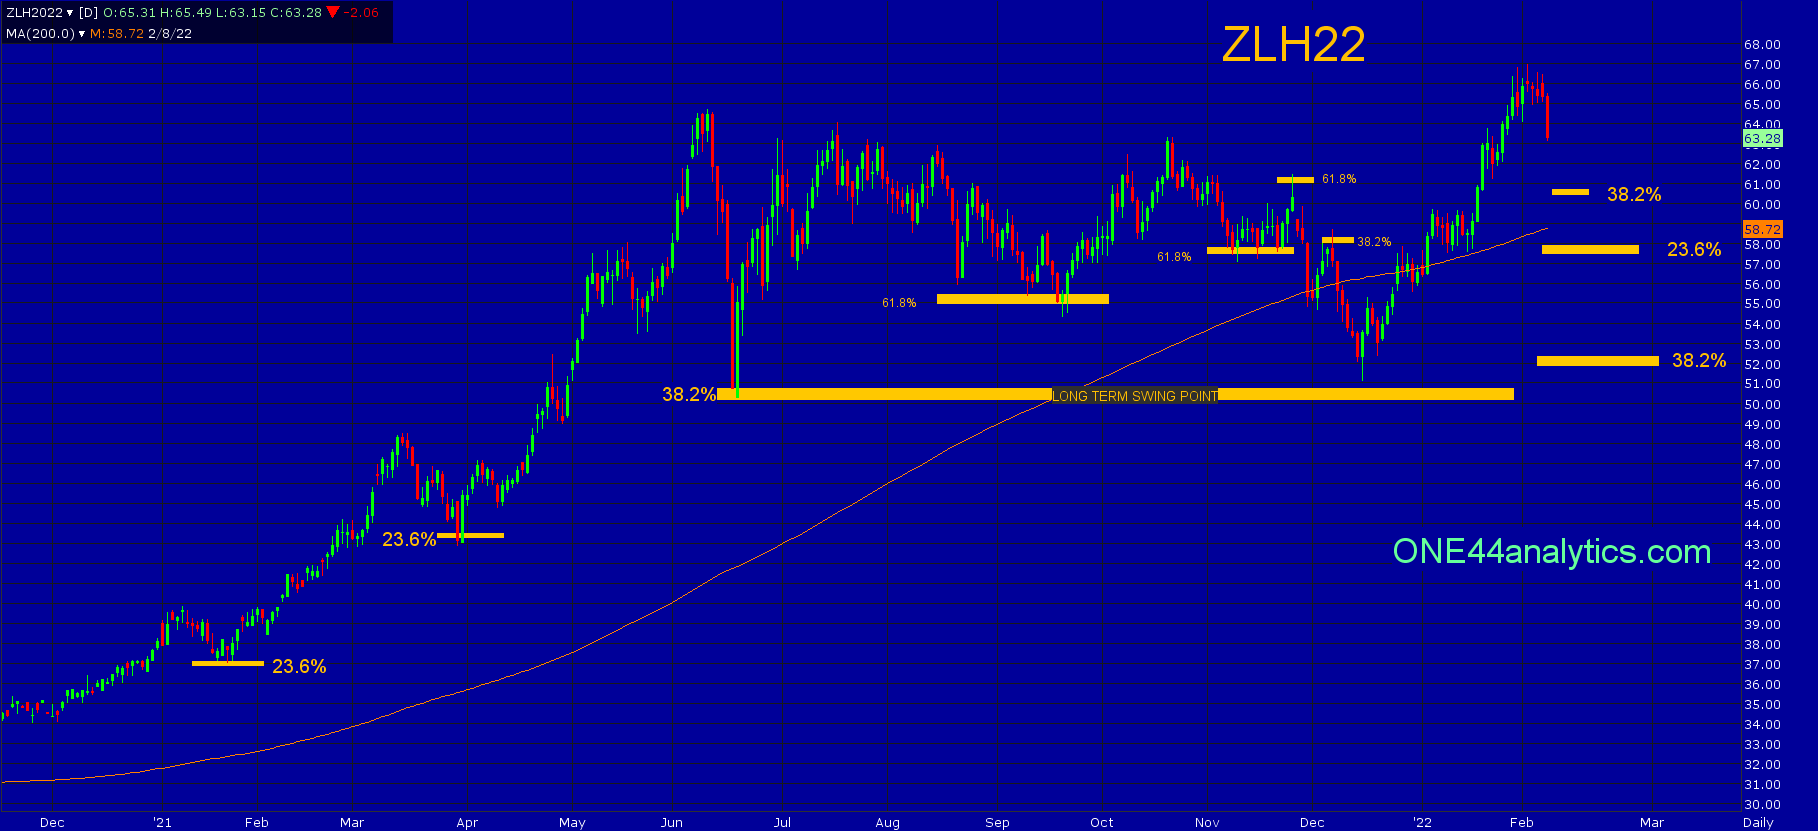
Soybean Oil
When the Soybean Meal was turning negative back in June of last year Oil held the long term swing point at 50.75 on 6/17/21, this was 38.2% of the contract high and low keeping the trend positive. The two previous setbacks held 23.6% of the rally on 1/20/21 and 3/30/21 showing an extremely strong market.
When dealing with the contract high and a major 38.2% level below, it can take months to get that new high out as is what happened after holding the long term swing point. There were plenty of retracements in between those two levels, even more than are posted on the chart below, however you never want to lose sight of what the long term trend is and the target for it.
The retest of the long term swing point on 12/15/21 started the rally that finally made the new high. Our long term target is 81.00 as long as it remains above the new long term swing point of 52.25. Other levels to look for support on any setback is 38.2% of the 6/17/21 low at 60.75 and then 23.6% of the contract high and low at 57.90.
Keep an eye on the March Soybeans, a close back below the 1560.00 major Gann square can cause a setback in the main market as mentioned in our post yesterday.
Sign up for our Free newsletter here.
If you are looking for option plays to go with the ONE44 levels, we highly recommend going to the Barchart webinar library where John Rowland has plenty of information on Option strategies.
Here is one, Using the Long Strangle Options Strategy for Opportunity Trades
FULL RISK DISCLOSURE: Futures trading contains substantial risk and is not for every investor. An investor could potentially lose all or more than the initial investment. Commission Rule 4.41(b)(1)(I) hypothetical or simulated performance results have certain inherent limitations. Unlike an actual performance record, simulated results do not represent actual trading. Also, since the trades have not actually been executed, the results may have under- or over-compensated for the impact, if any, of certain market factors, such as lack of liquidity. Simulated trading programs in general are also subject to the fact that they are designed with the benefit of hindsight. No representation is being made that any account will or is likely to achieve profits or losses similar to those shown. Past performance is not necessarily indicative of future results.