Gold Update
law
ONE44 Analytics where the analysis is concise and to the point
GOLD/GCG21
This is an update to the 1/14/21 post below,
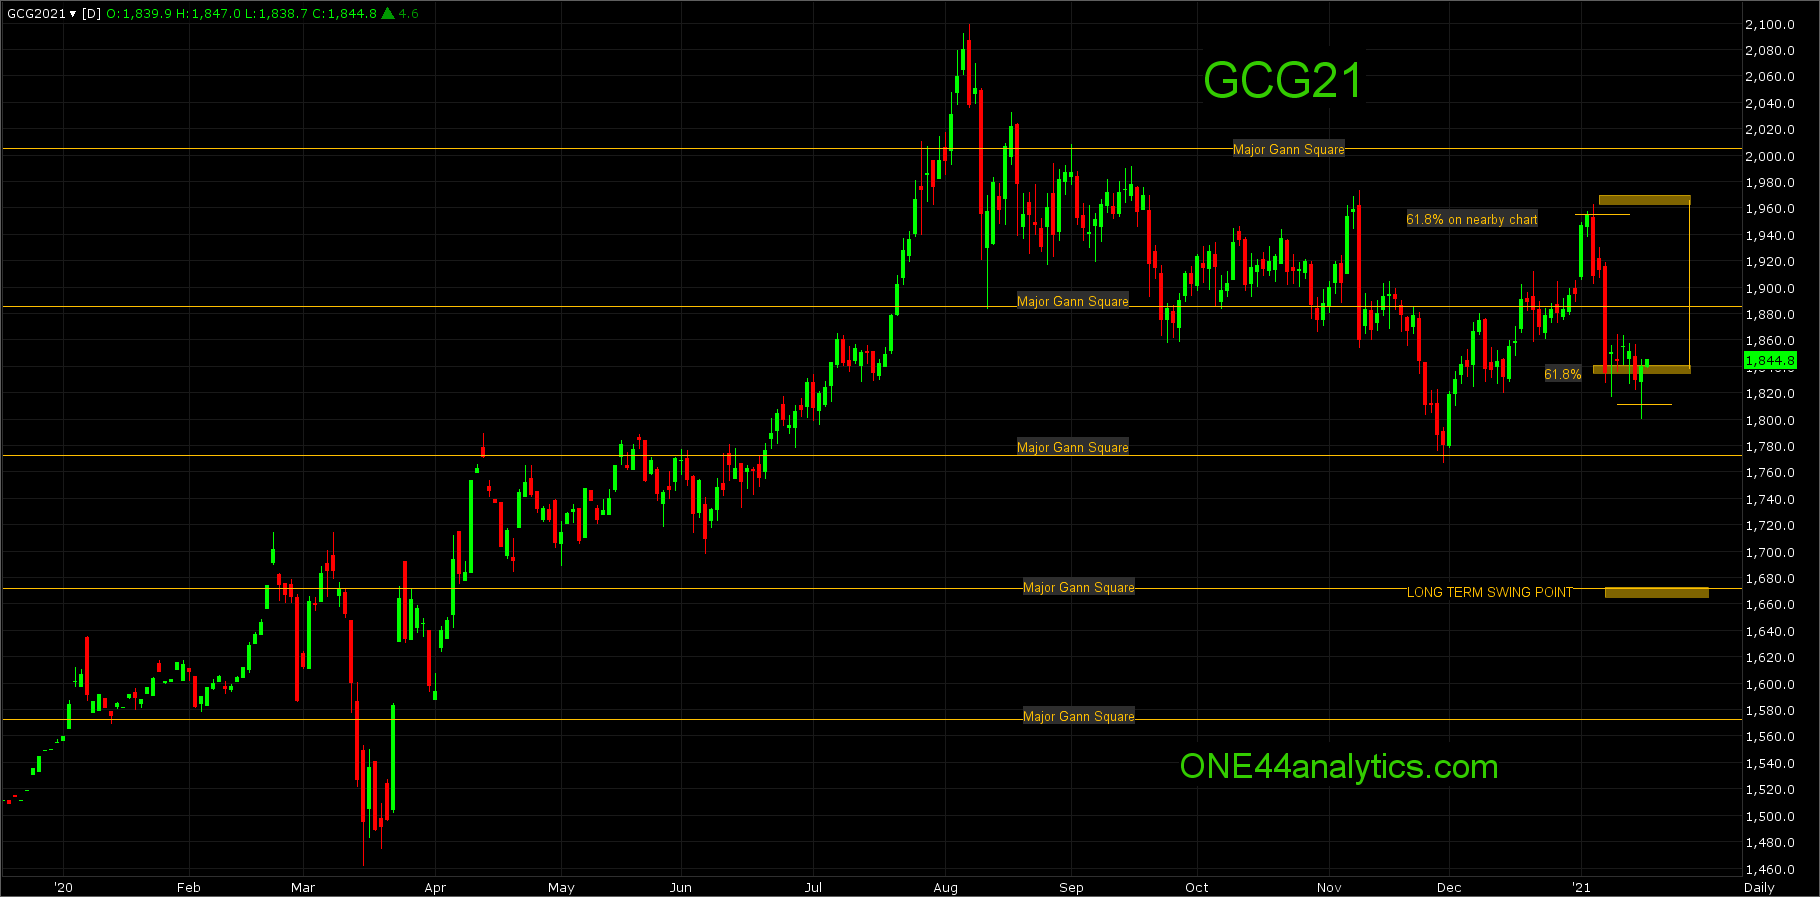
GCG21
The break from 61.8% on the Nearby chart has hit 61.8% back of the move up at 1842.00, this is now the short term swing point, above it, we will look for 61.8% back up at 1912.00, per the 61.8% rule. This could also cause a longer term trading range between the 61.8% levels that could last for weeks, if not months. With a couple solid close's below 1842.00 look for 1811.00 and below here look for the long term swing point at 1700.00. This is 61.8% back to the March 2020 low and 38.2% back to the 2015 low
Currently,
They traded down below 1811.00 and quickly rallied back to 1842.00. With a close back above 1842.00 we will look for a rally up to at least 1912.00 and even back to 61.8% to the ATH. By getting back up above 1842.00 it brings back the idea that this can turn into a large trading range between the 61.8% levels of 1842.00 and 1955.00. With the solid close below 1811.00 the long term target is 1700.00 as mentioned above.
As always we highly recommend you use the secondary Gann square hourly chart below for the short term support/resistance, swing points and targets. This is based on W.D. Gann's "Law of Vibration"
This is our latest video on how to use the Fibonacci retracements. Even if you do not trade the market covered, the rules and guidelines are the same, as we believe the Fibonacci retracements are the underlying structure of all markets.