Grains
ONE44 Analytics where the analysis is concise and to the point
Our goal is to not only give you actionable information, but to help you understand why we think this is happening based on pure price analysis with Fibonacci retracements and Gann squares.
GRAINS
The Soybeans, Corn and Wheat have traded sideways for the last month with a slight upward bias. The setbacks from their current highs have held the tightest retracement of 23.6% keeping these markets extremely strong.
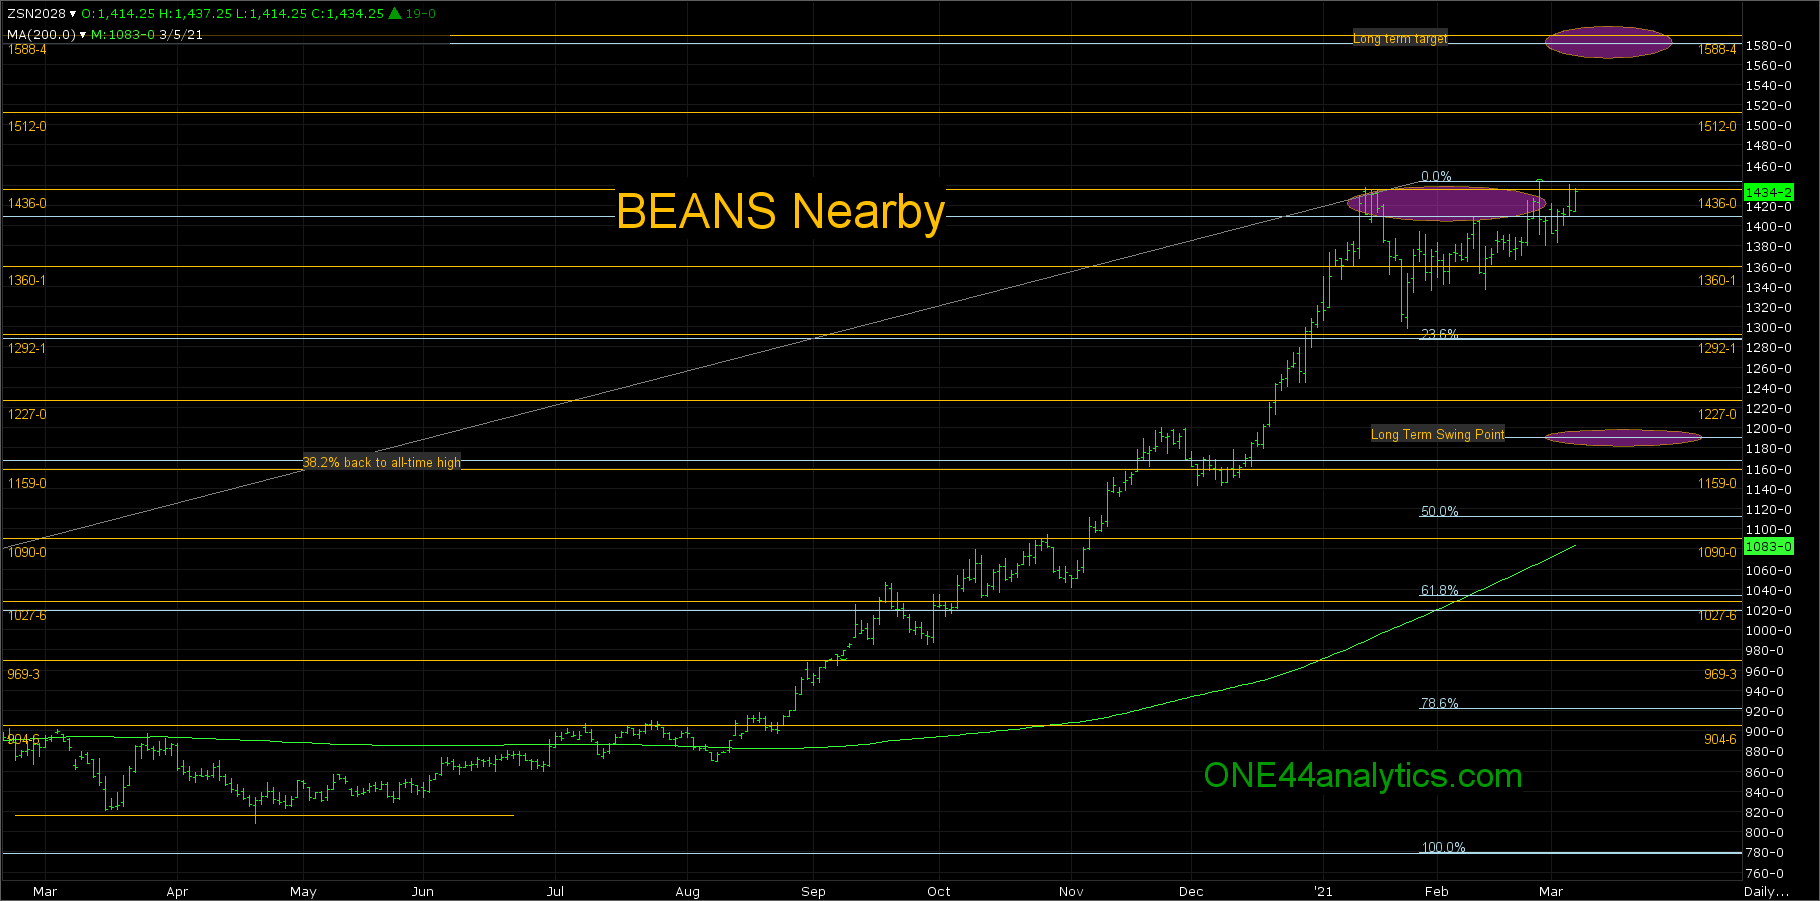
Soybeans
The first setback from our long term target of 1410.00 and the 1436.00 major Gann square held the area of 1292.00 to 1285.00, this is a major Gann square and 23.6% back to the 2019 low. The second setback from the same area traded below 38.2% back to the 1/25/21 low, but never closed below it, keeping the market very strong. However they still need to get a solid close above the 1436.00 major Gann square to breakout and give us a new upside target of 1580.00, this is 78.6% back to the all-time high and a major Gann square. Once they close above 1436.00 it will become the swing point. What you don't want to see is, it trades above and close back below, they did this a week and a half ago, but held 38.2% of the rally from the 1/25/21 low. If they do this again and take out that 38.2% level the long term target will be 1190.00, this is our long term swing point.
Corn
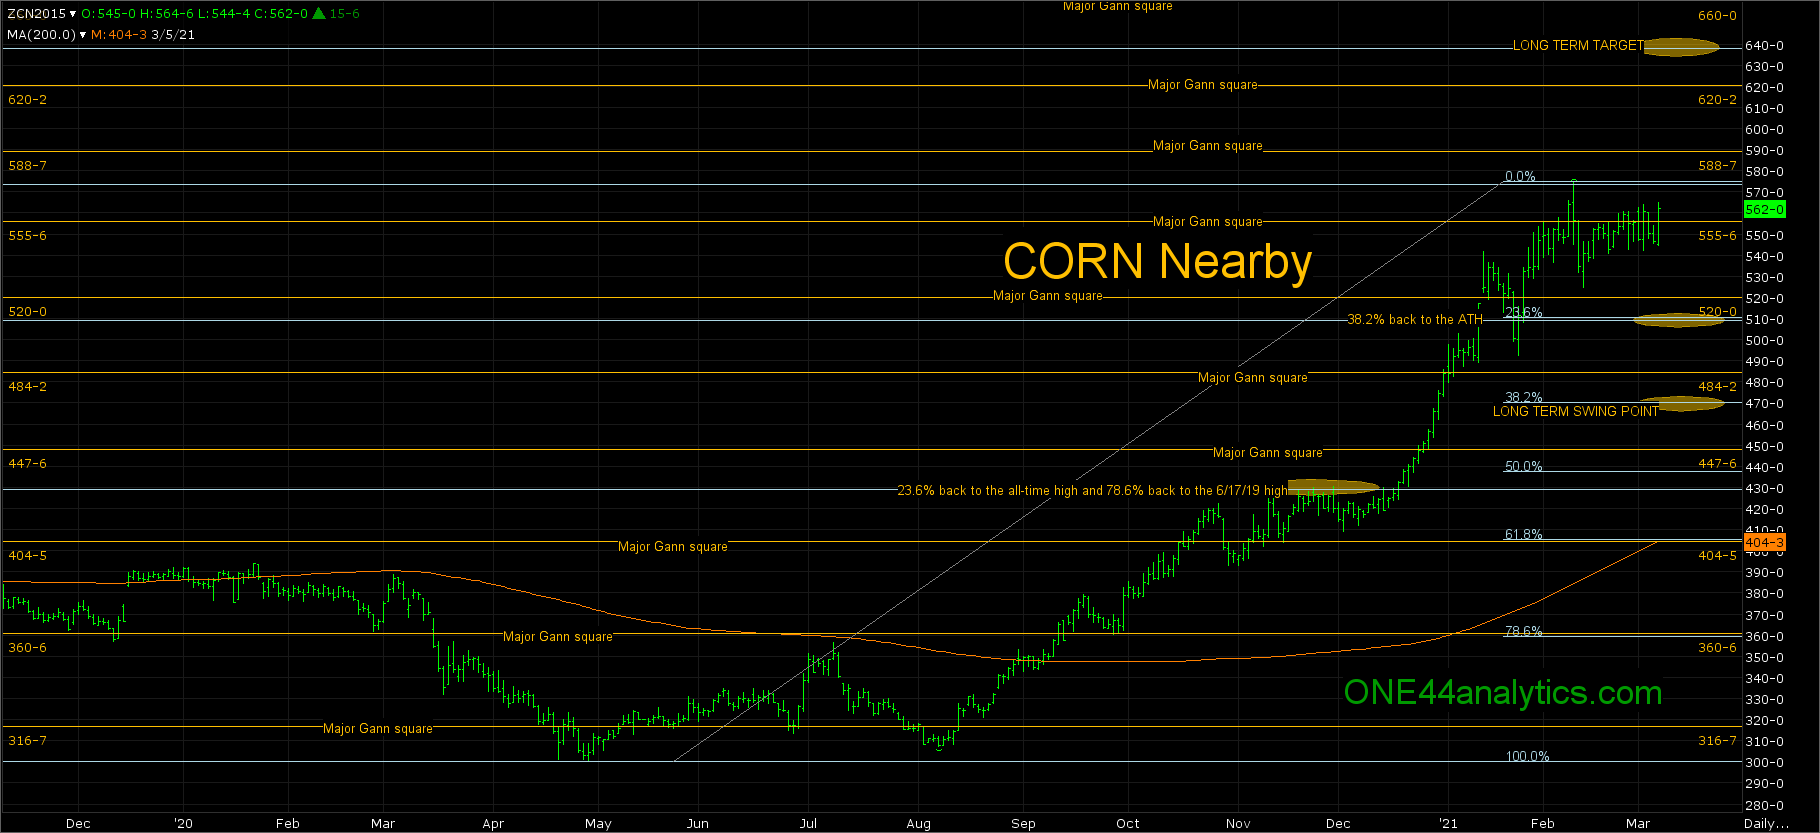
The setback from this year's high held above 511.50, this is 23.6% back to the 2020 low and it puts it back on top of 38.2% back to the all-time high. They also held above the 520.00 major Gann square. For the last five weeks they have been trading above and below the 555.75 major Gann square, mostly below. Friday's close was above it and as long as they can stay above it, look for the long term target of 640.00, this is 61.8% back to the all-time high. Before then there are two major Gann squares to look for resistance at 588.75 and 620.25. The long term swing point remains at 470.00, this is 38.2% back to the 2020 low, this is the level that must hold to keep the long term trend intact and our idea that this is going to be a multi year rally, that we have been saying since the fall of last year.
Wheat
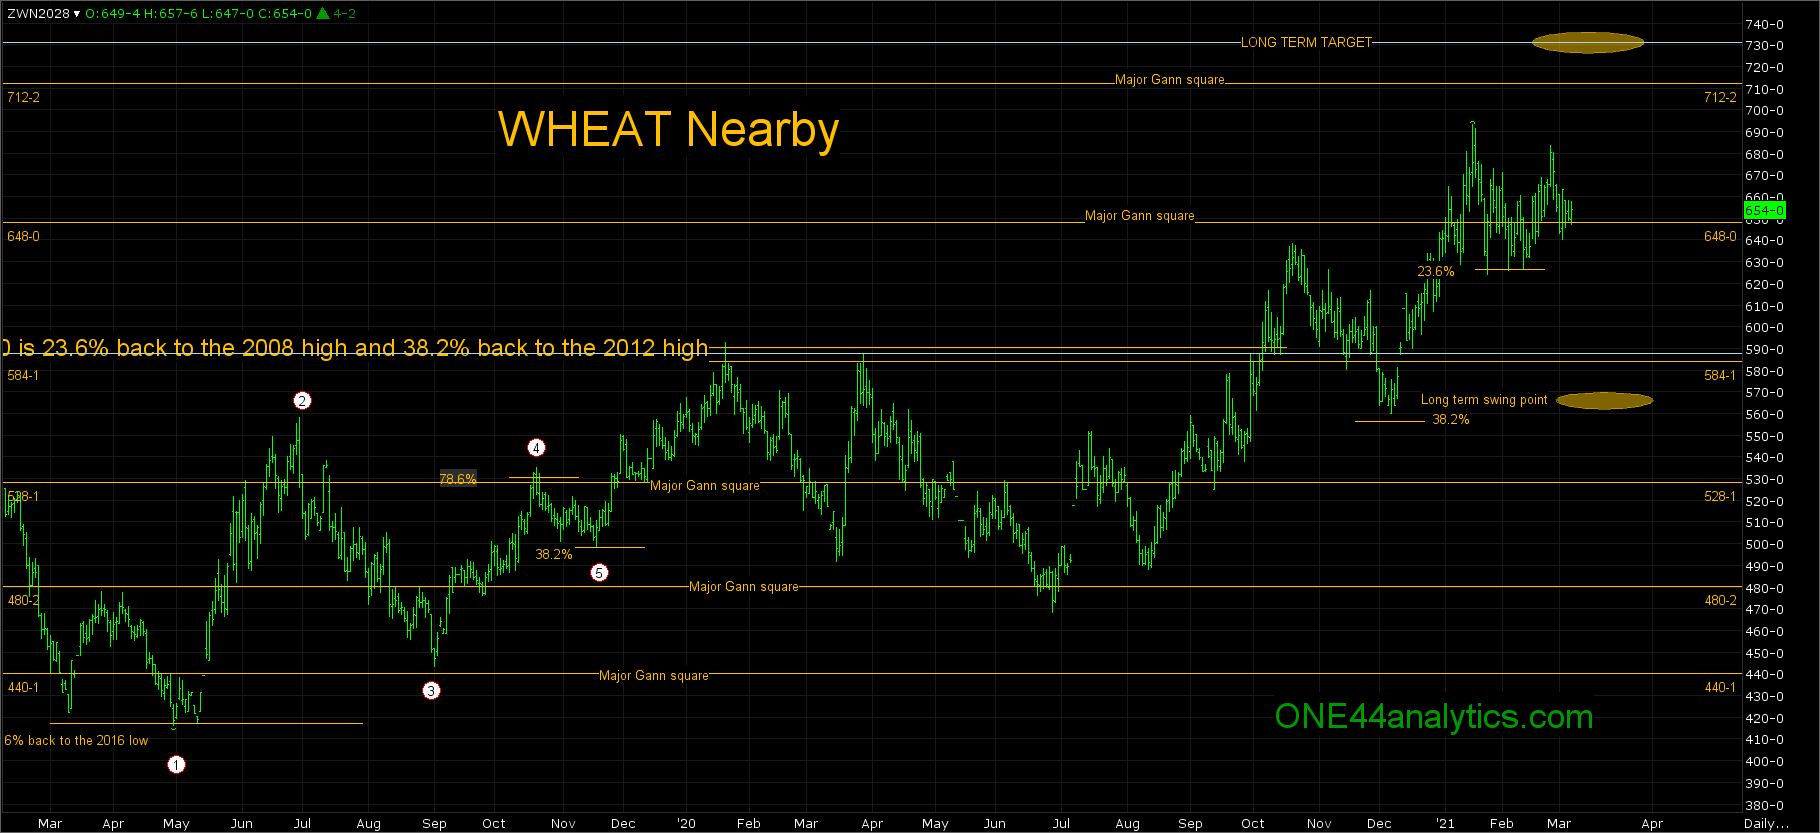
The break from this year's high held 626.00, this is 23.6% back to the 2020 low. They are currently above the 648.00 major Gann square and as long as they stay above it look for our long term target of 730.00, this is 38.2% back to the all-time high. There is one other major Gann square to look for resistance at 712.25. With a failure to hold above 23.6% at 626.00 look for a trade down to our long term swing point of 565.00, this is 38.2% back to the 2020 low.
You can get all the rules and guidelines to the Fibonacci retracements on our website
Sign up for our Free newsletter here.