Grains long term update
ONE44 Analytics where the analysis is concise and to the point
Our goal is to not only give you actionable information, but to help you understand why we think this is happening based on pure price analysis with Fibonacci retracements, that we believe are the underlying structure of all markets and Gann squares.
For the ONE44 Fibonacci rules and guidelines to help with this article, go here.
Charts are courtesy of Barchart.com
Grains
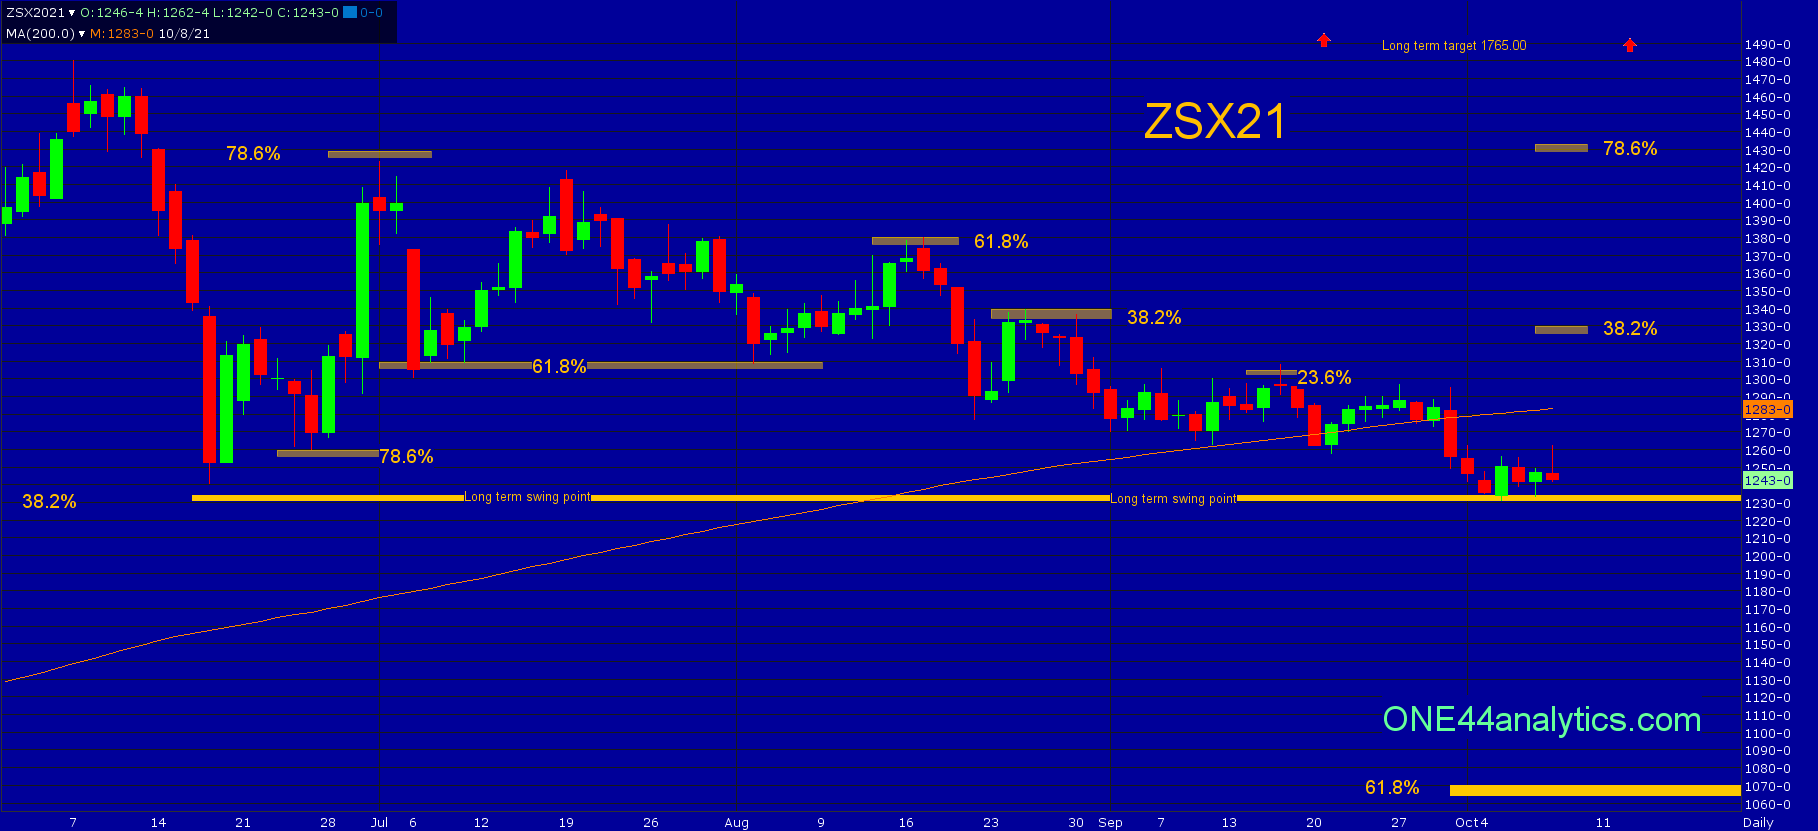
Soybeans
Beans continue to hold just above the long term swing point of 1235.00, this is 38.2% of the contract high and 2020 low. Provided they hold this level the long term target is new highs for the year and then 1765.00, however the first rally from here needs to take out 38.2% of the break from the contract high, this 1325.00. Taking this out will turn the short term trend positive again. Below 1235.00 the next target becomes 61.8% at 1070.00.
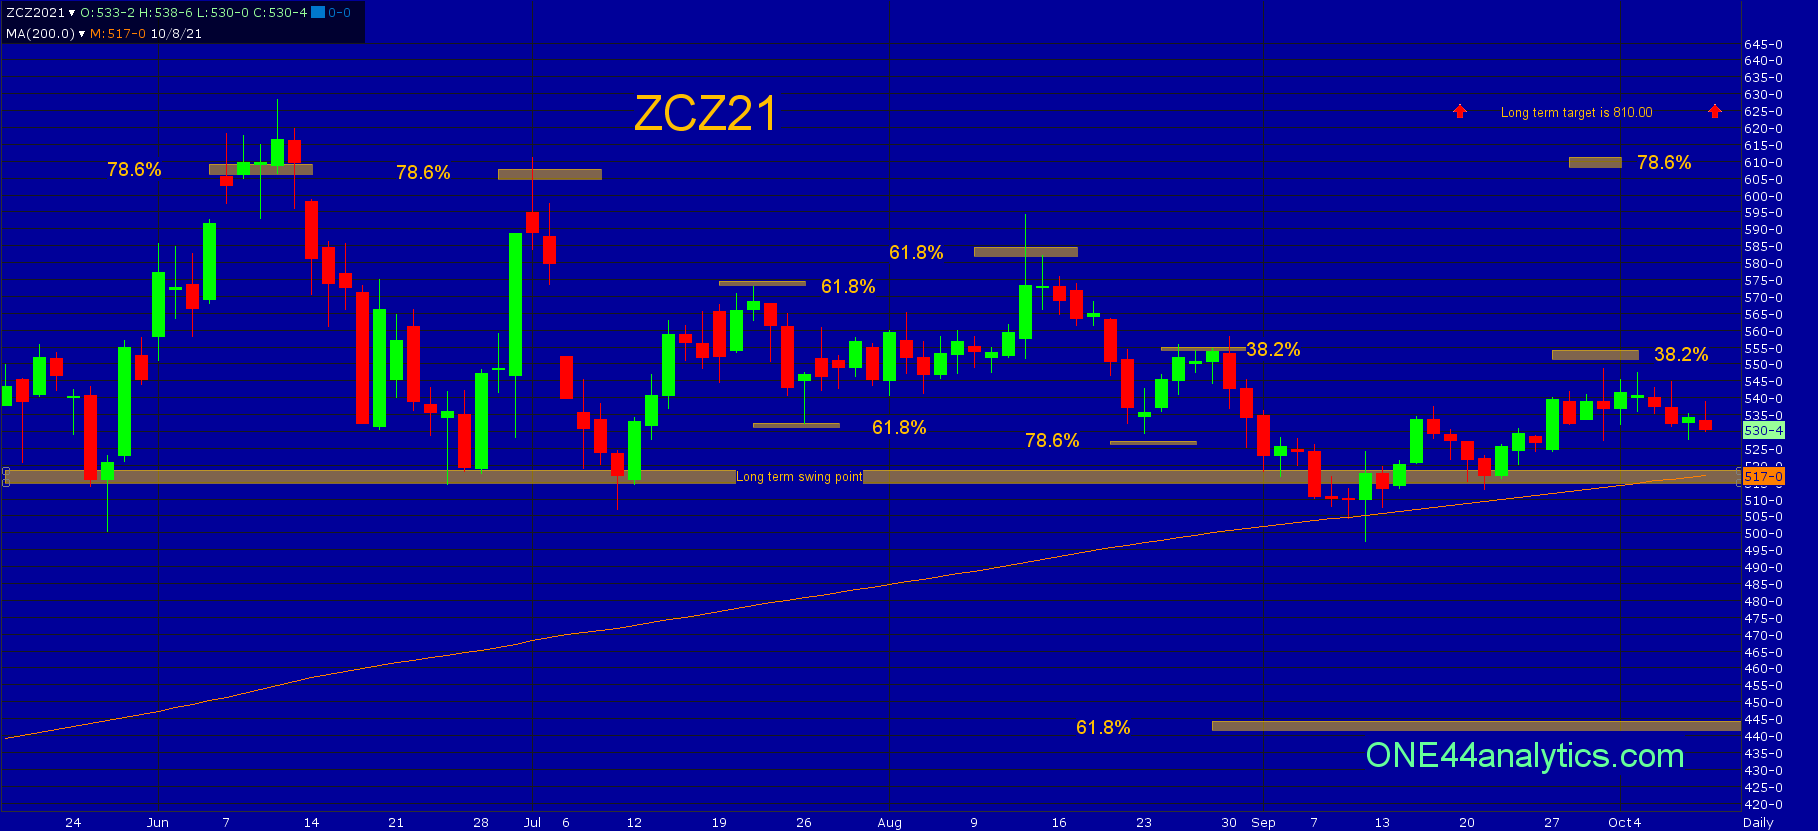
Corn
Corn is also sitting just above their long term swing point 518.00. The last rally from it failed to get above 38.2% of the contract high at 550.00, until it can take this out the short term trend is negative. Above it, look for 78.6% at 610.00 and then our long term target of 810.00. With a solid close below 518.00 the long term trend turns negative and you can look for 61.8% at 445.00.
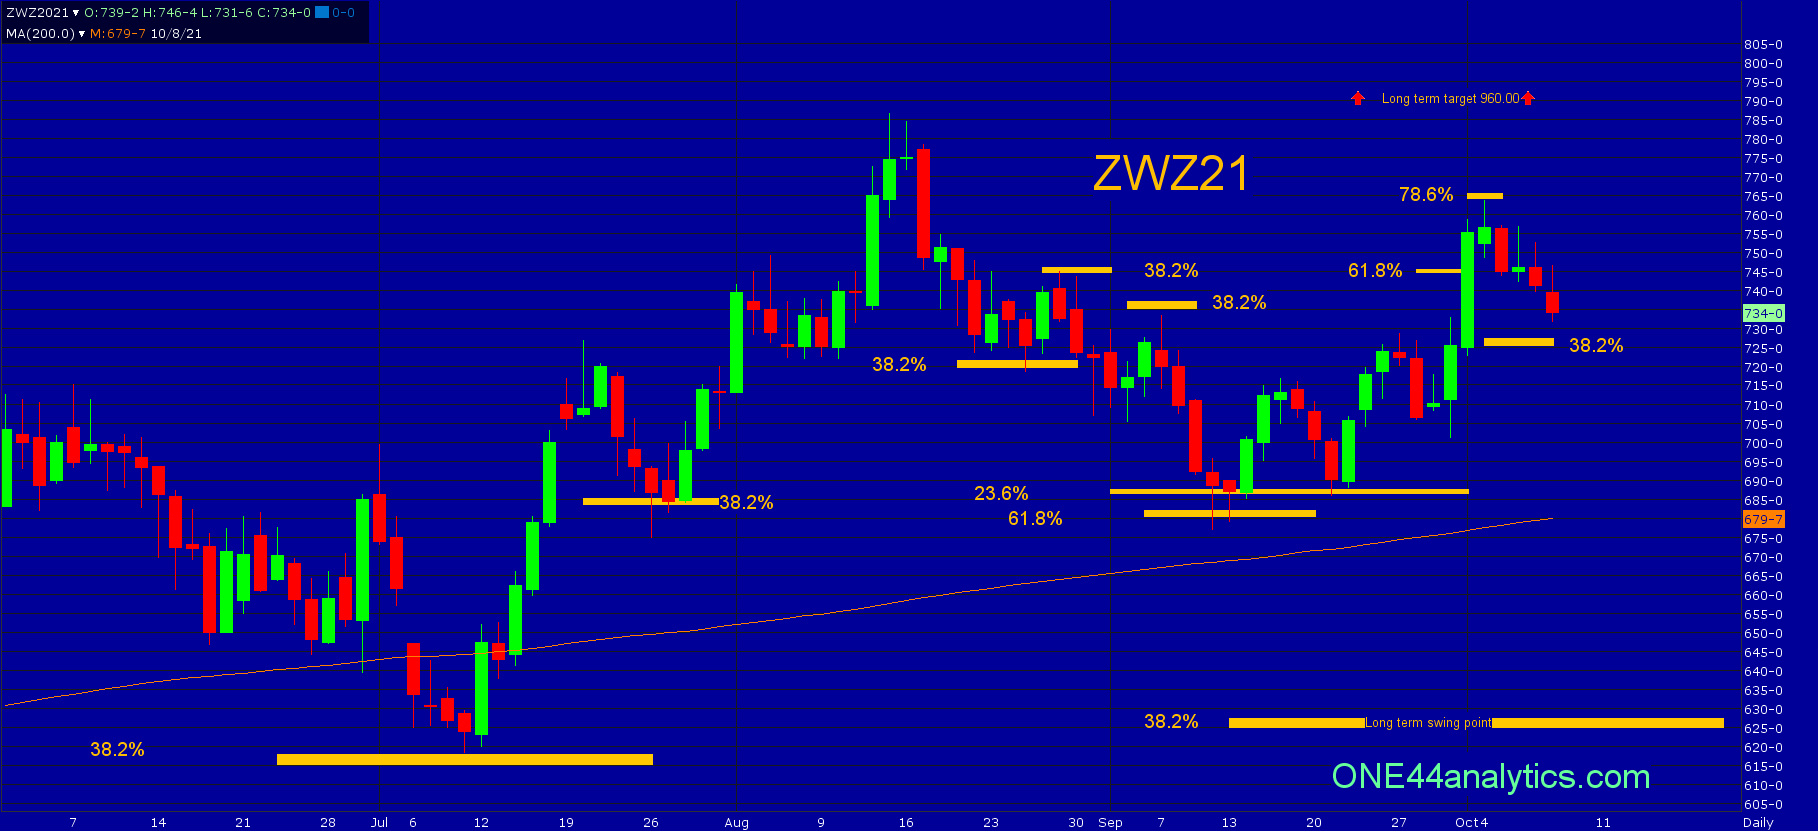
Wheat
Wheat remains the strongest of the 3 , however the recent rally hit 78.6% at 765.00 and following the ONE44 Fibonacci 78.6% rule, we know this is where a lot of Bull runs end and start. The first test will be at 38.2% of the recent leg up, this is 727.00. Holding this should send it to new highs and then the long term target of 960.00. Not holding 727.00 should send it to retest the combination of retracements on the chart at 688.00 to 682.00. The long term swing point is still down at 627.00.
Sign up for our Free newsletter here.
FULL RISK DISCLOSURE: Futures trading contains substantial risk and is not for every investor. An investor could potentially lose all or more than the initial investment. Commission Rule 4.41(b)(1)(I) hypothetical or simulated performance results have certain inherent limitations. Unlike an actual performance record, simulated results do not represent actual trading. Also, since the trades have not actually been executed, the results may have under- or over-compensated for the impact, if any, of certain market factors, such as lack of liquidity. Simulated trading programs in general are also subject to the fact that they are designed with the benefit of hindsight. No representation is being made that any account will or is likely to achieve profits or losses similar to those shown. Past performance is not necessarily indicative of future results.