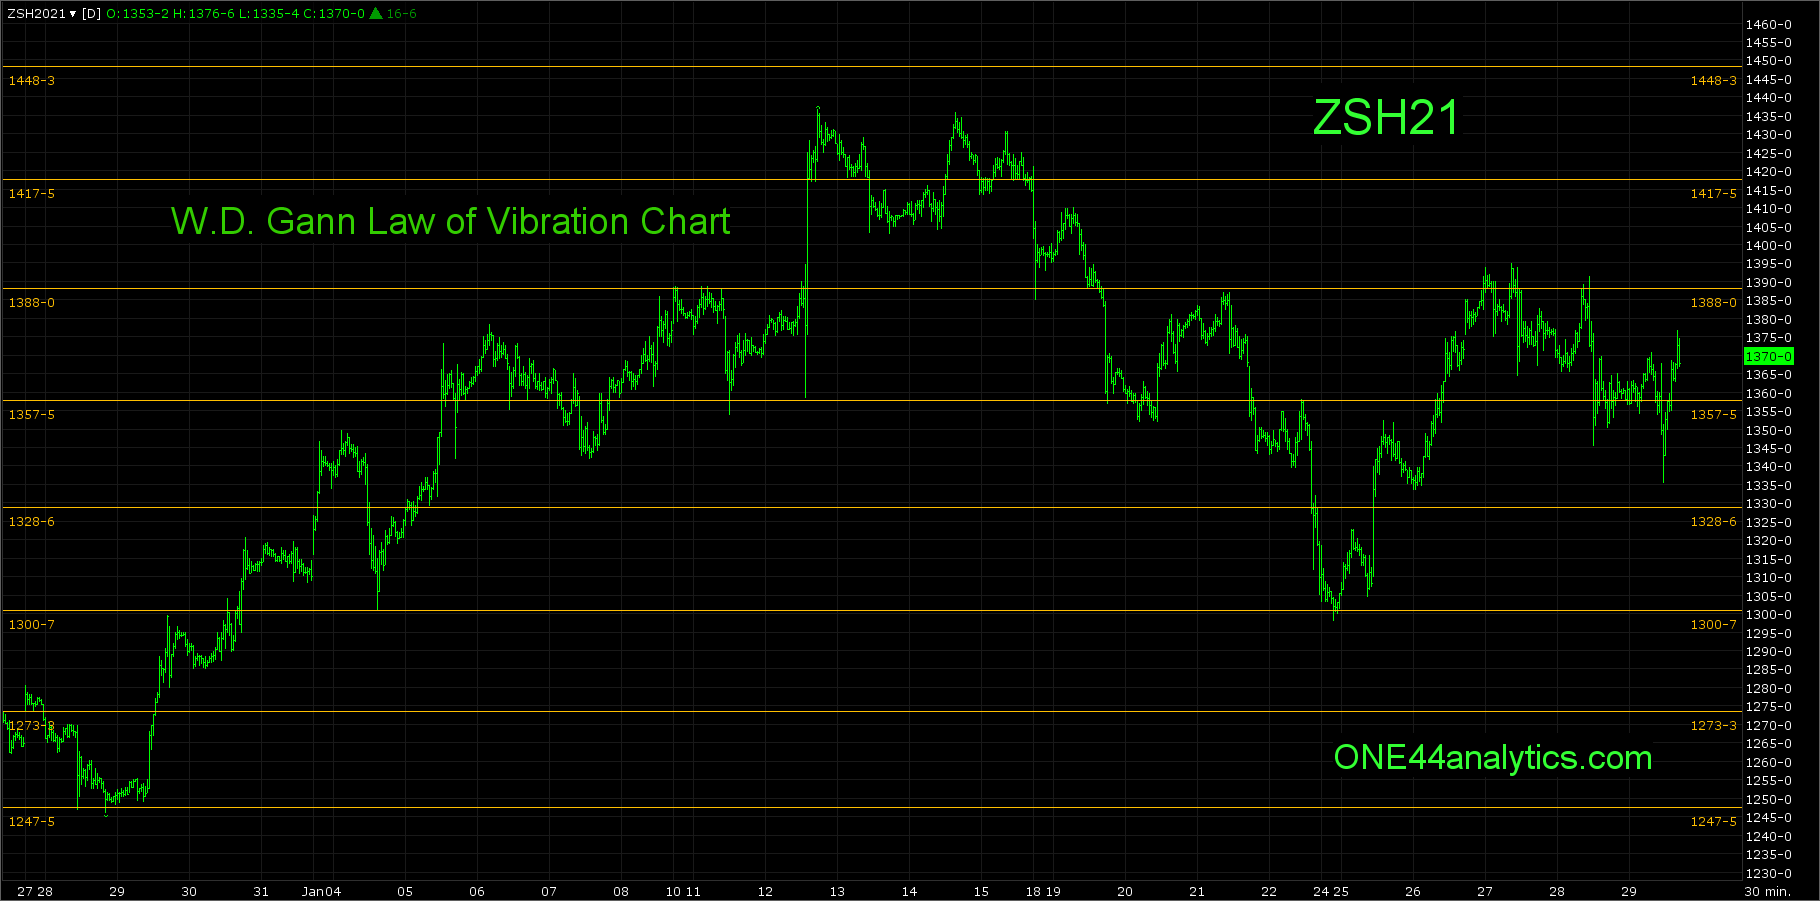
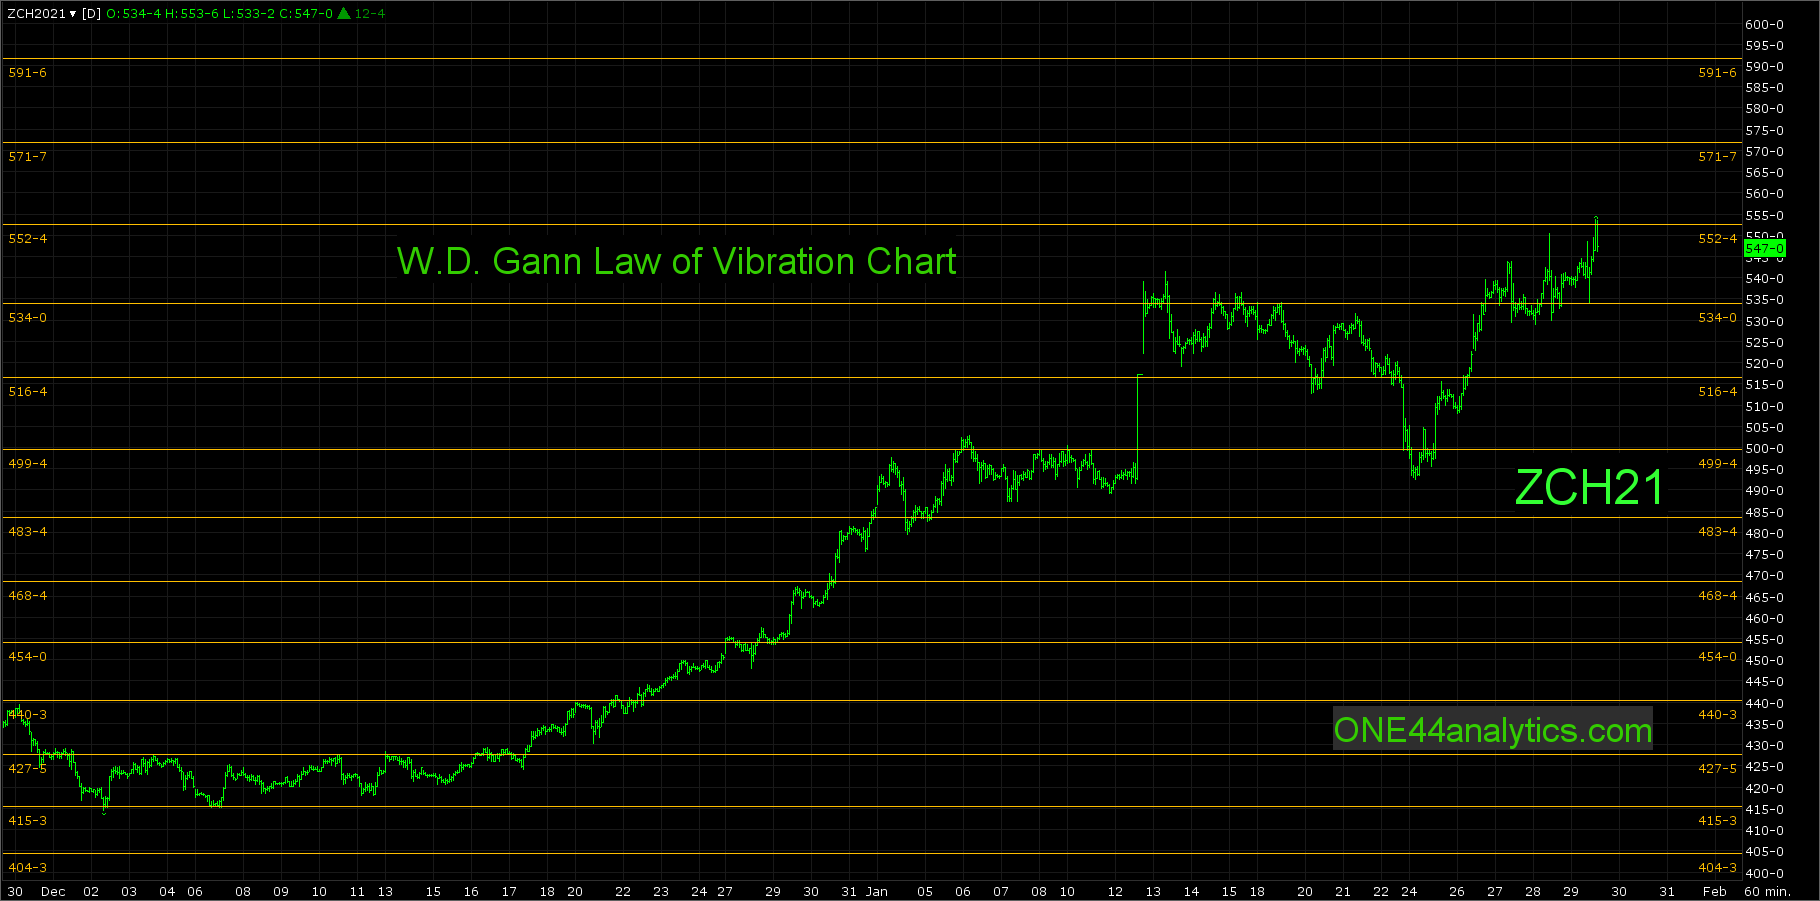
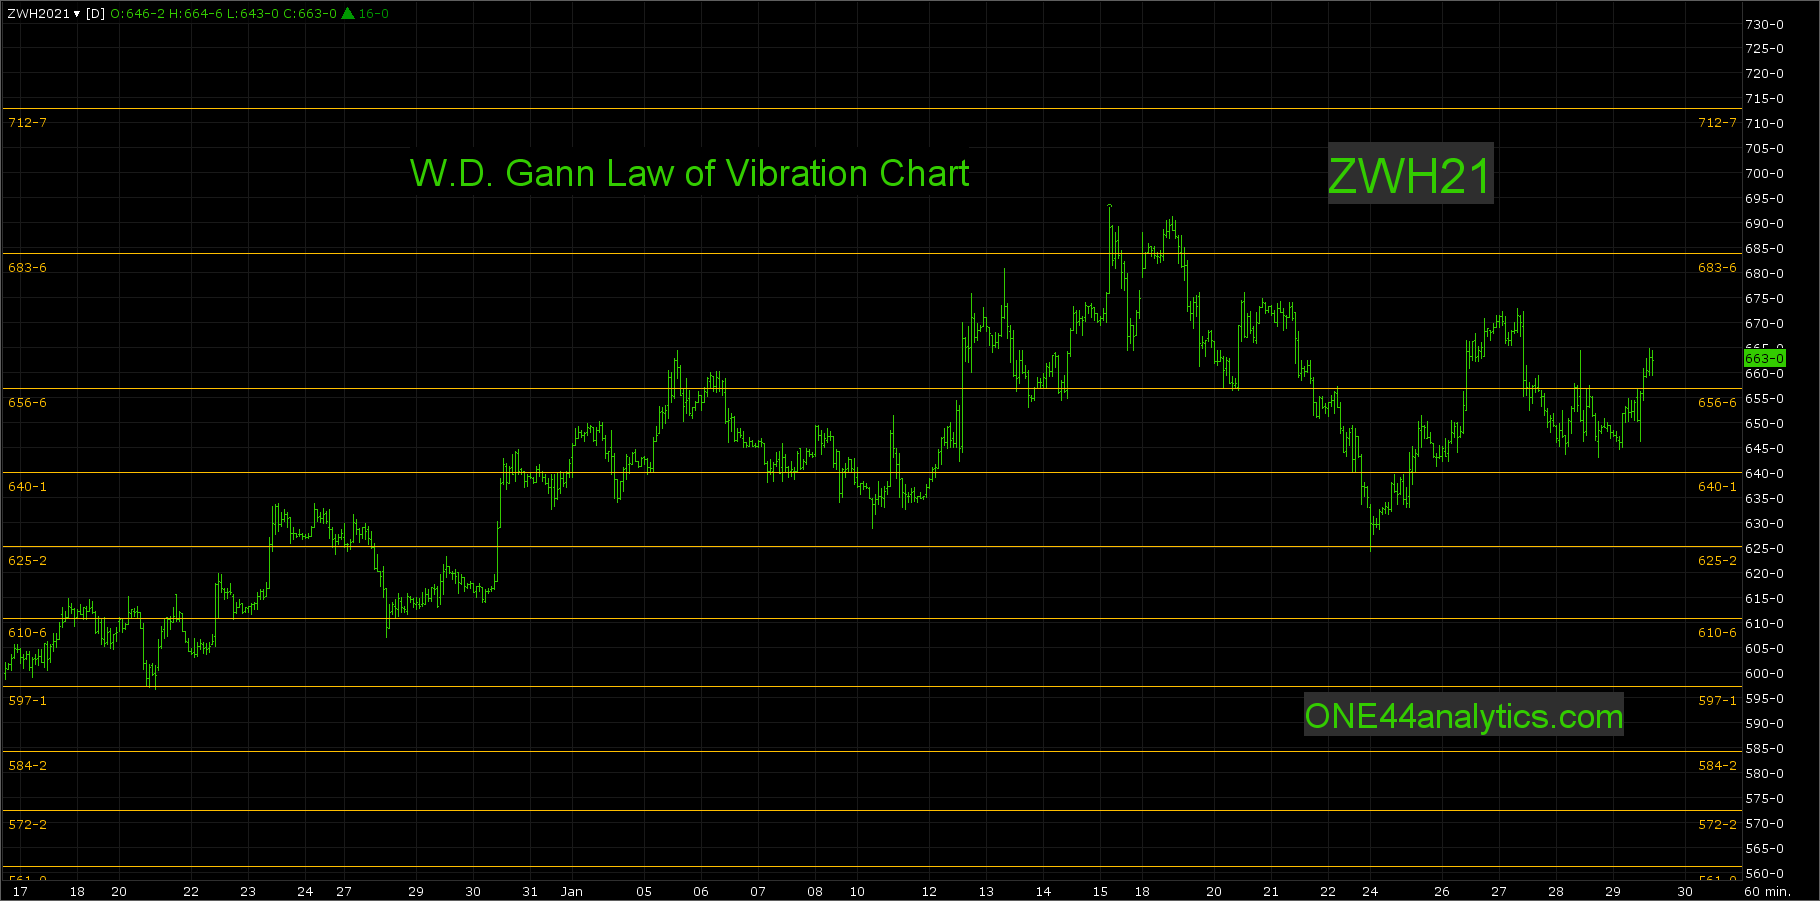
Grains, support/resistance
The Charts below are natural support and resistance levels that are based on W.D.Ganns "Law of Vibration".
Mr Gann viewed stocks as live electrons, atoms, and molecules which hold persistently to their own individuality in response to the fundamental Law of Vibration. Science teaches 'that an original impulse of any kind finally resolves itself into periodic or rhythmical motion, also just as the pendulum returns again in its swing, just as the moon returns in its orbit, just as the advancing year ever brings the rise or spring, so do the properties of the elements periodically recur as the weight of the atoms rises'.
Each level can be used as support and then resistance once taken out and the reverse when starting as resistance. These levels will be good until the end of each contract.
Our goal is to not only give you actionable information, but to help you understand why we think this is happening based on pure price analysis with Fibonacci retracements and Gann squares.
You can get all the rules and guidelines to the Fibonacci retracements on our website
Sign up for our Free newsletter here.