Here's what it's going to take to get ARKK to float again
ONE44 Analytics where the analysis is concise and to the point
Our goal is to not only give you actionable information, but to help you understand why we think this is happening based on pure price analysis with Fibonacci retracements, that we believe are the underlying structure of all markets and Gann squares.
For the ONE44 Fibonacci rules and guidelines to help with this article, go here.
Charts are courtesy of Barchart.com
This is our latest video in an ongoing series of how to use the Fibonacci retracements. Even if you do not trade the market covered, the ONE44 rules and guidelines are the same, as we believe the Fibonacci retracements are the underlying structure of all markets.
https://youtu.be/HEyLVbjvHDg
ARK Innovation ETF
As you may have seen in our previous post, we show why we believe the Fibonacci retracements are the underlying structure of all markets. We have covered Grains, Cryptocurrencies and a lot of stocks. In this example we show that even a basket of stocks like ARKK is not immune to the same underlying structure.
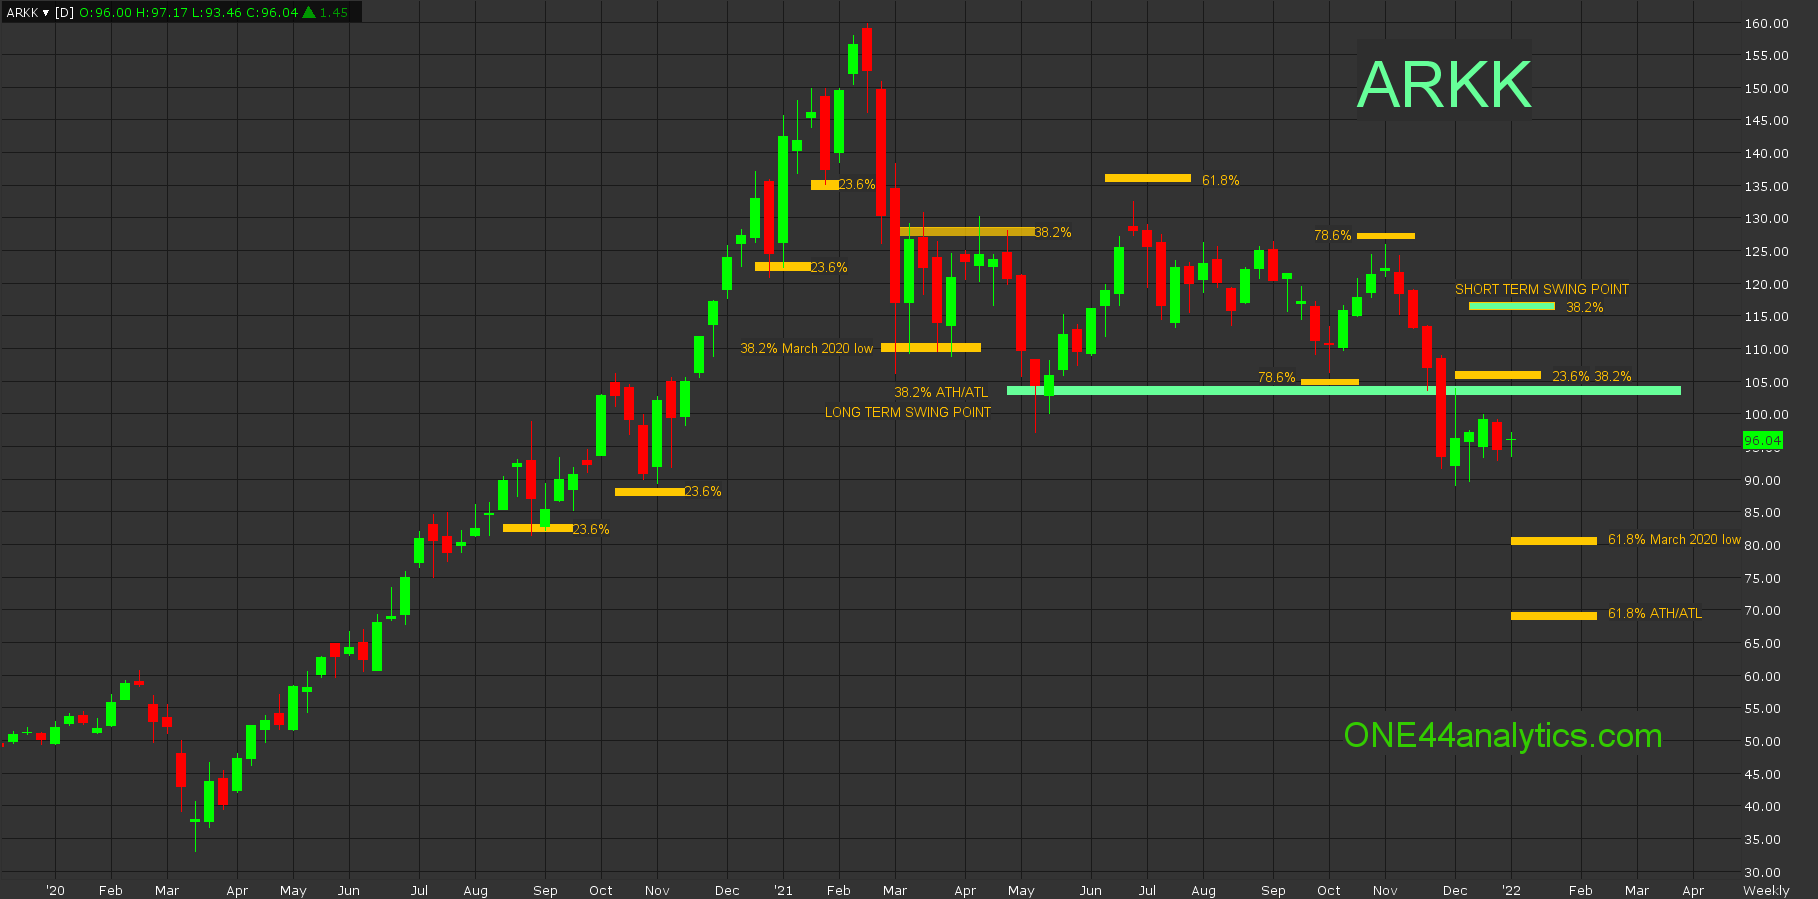
Starting with the March 2020 low, each of the measurable setbacks came to 23.6%, following the ONE44 Fibonacci rules and guidelines we know that by holding this level the market is extremely positive and in a runaway phase. This all may seem simple and it partly is, however had you been aware of each of these levels you would have caught the explosive moves that followed these retracements from 83.40 to 106.00, 89.10 to 137.00, 122.50 to 149.50 and 136.10 to 159.50.
Once the top was put in on 2/15/21 at 159.70, the first real test of the long term trend happened on 3/1/21. The most direct move up to the ATH came from the March 2020 low of 33.00, however you always want to know the extreme levels as well and in this case the ATL was 14.67. When using the 33.00 low, 38.2% is 110.80 and with the 14.67 low it is 104.40 and this is the long term swing point as pointed out by the ONE44 Fibonacci 38.2% rule. Back to the 3/1/21 low where it hit 110.80, being that it was 38.2%, it should have gone on to a new high, however as always we watch all the retracements on ever move to see just how strong, or weak the market is regardless of the longer term target, The rally from 110.80 could only get 38.2% (127.50) back to the ATH, it is never a good sign to be stopped by 38.2% of a smaller move after holding 38.2% of a major move. The market continued to trade between these two key levels for 9 weeks before making a new low. The new low hit 38.2% of the ATH and ATL, as you can see on the chart, it traded below the long term swing point, but never had a weekly close below it. The target on a rally from here would again be new highs for the move.
The next rally did get through 38.2%, but failed to reach 61.8% marked on the chart at 135.50. The setback from there did two things, one it retested the long term swing and two it hit 78.6% (106.40) of the 97.22 low and 132.50 high. Following the 78.6% rule, we should look for a 78.6% retracement the other way and this was accomplished at 125.80.
The move down from there brings us to where we are now, that move took out the long term swing point of 104.40, since this was 38.2% it tells us to look for 61.8%. We have the two major lows to watch this level from, the first is back to the March 2020 low, 61.8% is 81.60 and more importantly 61.8% of the ATL at 69.60, as long as it remains below104.40 this is the target. Even with getting back above the long term swing point, it will have to take out the short term swing point at 116.00 to have the short and long term trend in sync.
In short, below 104.40 we are looking for 81.60, above it 116.00, once they get above 116.00, ARKK is floating again!
We hope this shows you that without knowing the stocks in the basket, or amount of each, or the complexity of each stock that you can follow any market using the ONE44 Fibonacci retracement rules and guidelines.
Sign up for our Free newsletter here.
FULL RISK DISCLOSURE: Futures trading contains substantial risk and is not for every investor. An investor could potentially lose all or more than the initial investment. Commission Rule 4.41(b)(1)(I) hypothetical or simulated performance results have certain inherent limitations. Unlike an actual performance record, simulated results do not represent actual trading. Also, since the trades have not actually been executed, the results may have under- or over-compensated for the impact, if any, of certain market factors, such as lack of liquidity. Simulated trading programs in general are also subject to the fact that they are designed with the benefit of hindsight. No representation is being made that any account will or is likely to achieve profits or losses similar to those shown. Past performance is not necessarily indicative of future results.