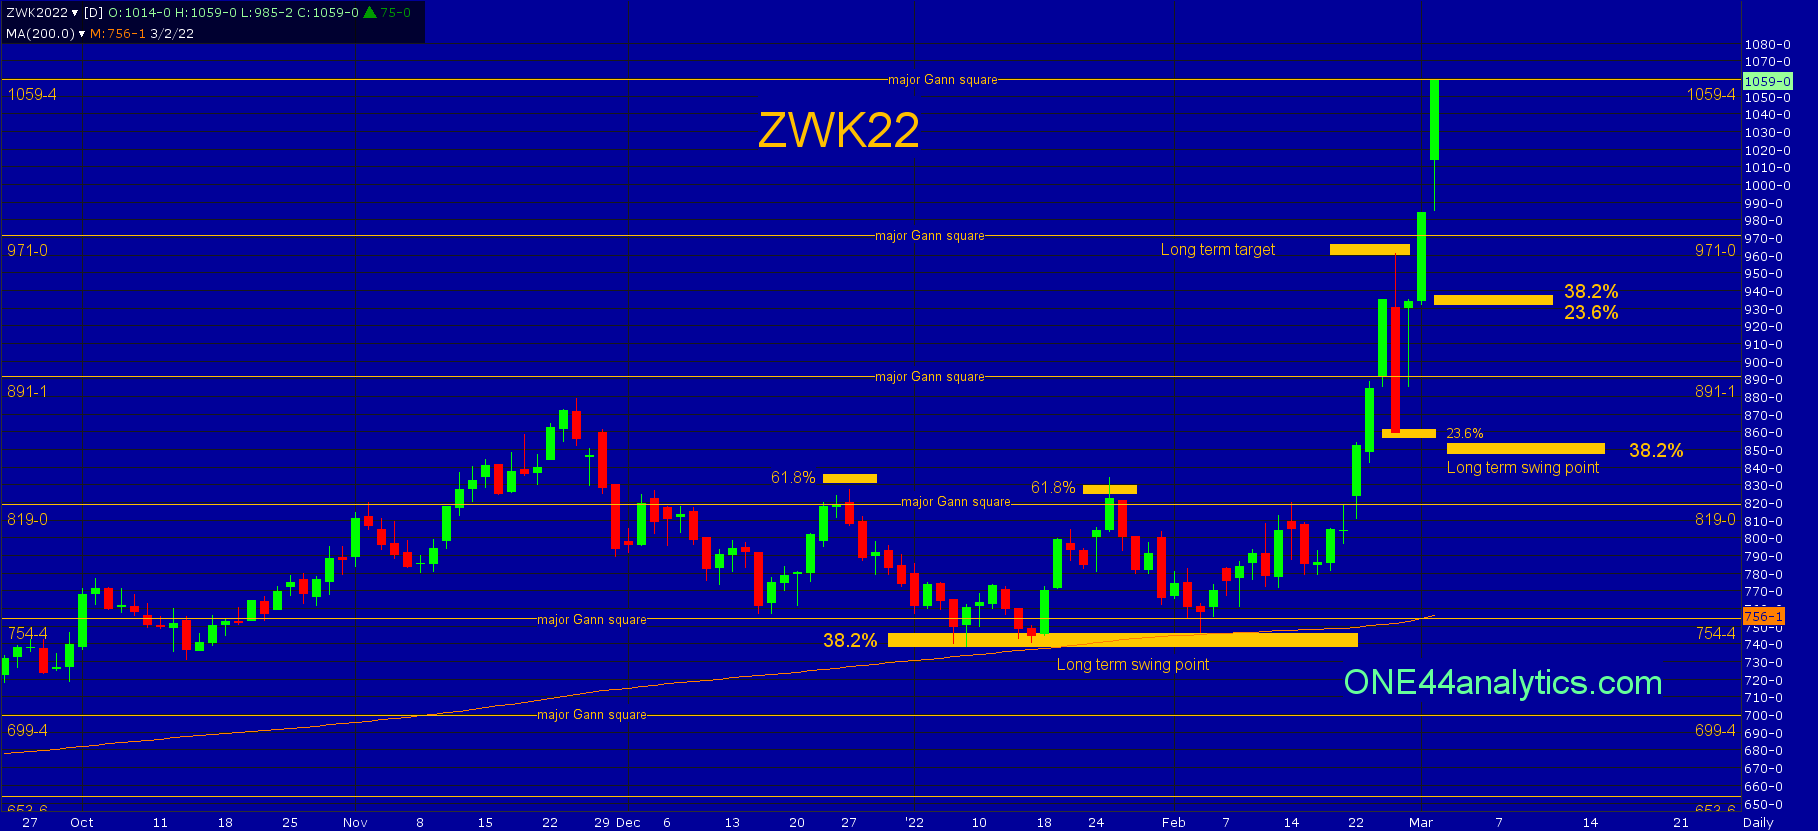
Huge Wheat rally came from the long term swing point

Wheat
From a technical analysis point of view, this is where the huge rally all started.
Back in the fall of 2020 we thought the market was going into a multi-year rally and said as much. We also know when using the Fibonacci retracements based on the ONE44 rules, any market that is going to continue its trend will have to hold 38.2%. This can be used on the biggest move as well as the smallest. The low on 1/6/22 hit 38.2% (745.00) so did the lows on 1/14/22 and 2/3/22. This was the long term swing point. The target when holding 38.2% is new highs.
The first rally hit 61.8% on 1/25/22, the break from it took it back to the long term swing point and that's when the real run up started again.
We posted our 960.00 long term target back in July of last year. The run up from the long term swing point took it right there. The $1.00 break from it was all done in a single day and hit 23.6% (860.00) back to the contract low. The rally from it is now up at 1059.00 and limit up. This is also a major Gann square.
On any setback from the 1059.00 high, look for 23.6% back to the contract low and 38.2% back to when it last hit the long term swing point, this is 936.00. The long term swing point is now up to 854.00.
All of these levels will move up with any new high.
You can find the Weekly Grain update: 3/1/22 HERE

Sign up for our Free newsletter here.
