JPM and GS
These two stocks show the importance of the long term levels and what retracement you are reacting from and what to expect.
The first thing is we know that 2754.00 is 23.6% back to the 2009 low in the S&P and that this is now our long term swing point and with much bigger things to coming on the downside with a couple closes below 2754.00 in a row, and that holding this area should send them back to the highs again, so I took a look at a couple other stocks besides the FANG's and MSFT to see what their key levels are.
I do realize that all of these levels will either hold, or fail at the same time, but at least this gives you the exact points in each stock to watch for.
The first is JPM and the long term levels,
Looking for a bottom in the massive sell off was like trying to catch a falling knife once they took out 38.2% of the Dec. 2018 low that was also the 200 day moving average. This made us go to the long term levels to look for the next major support. The bottom as it stands right now is at 38.2% back to the 2009 low, this level is 93.00 and it is now the long term swing point. Failing to hold this area should send them back to 61.8% of the same move at 63.50. Holding this area tells us it should go back to make new all-time highs per the 38.2% rule. This could take a long time and you have to watch the retracements going back up to see just how strong, or weak the market is. The first test will be 38.2% back up at 112.00, not getting above here will be a negative sign and you should look for the lows again. Above this is the 200 day average at 122.00 and 61.8% back to the all-time high at 122.50.

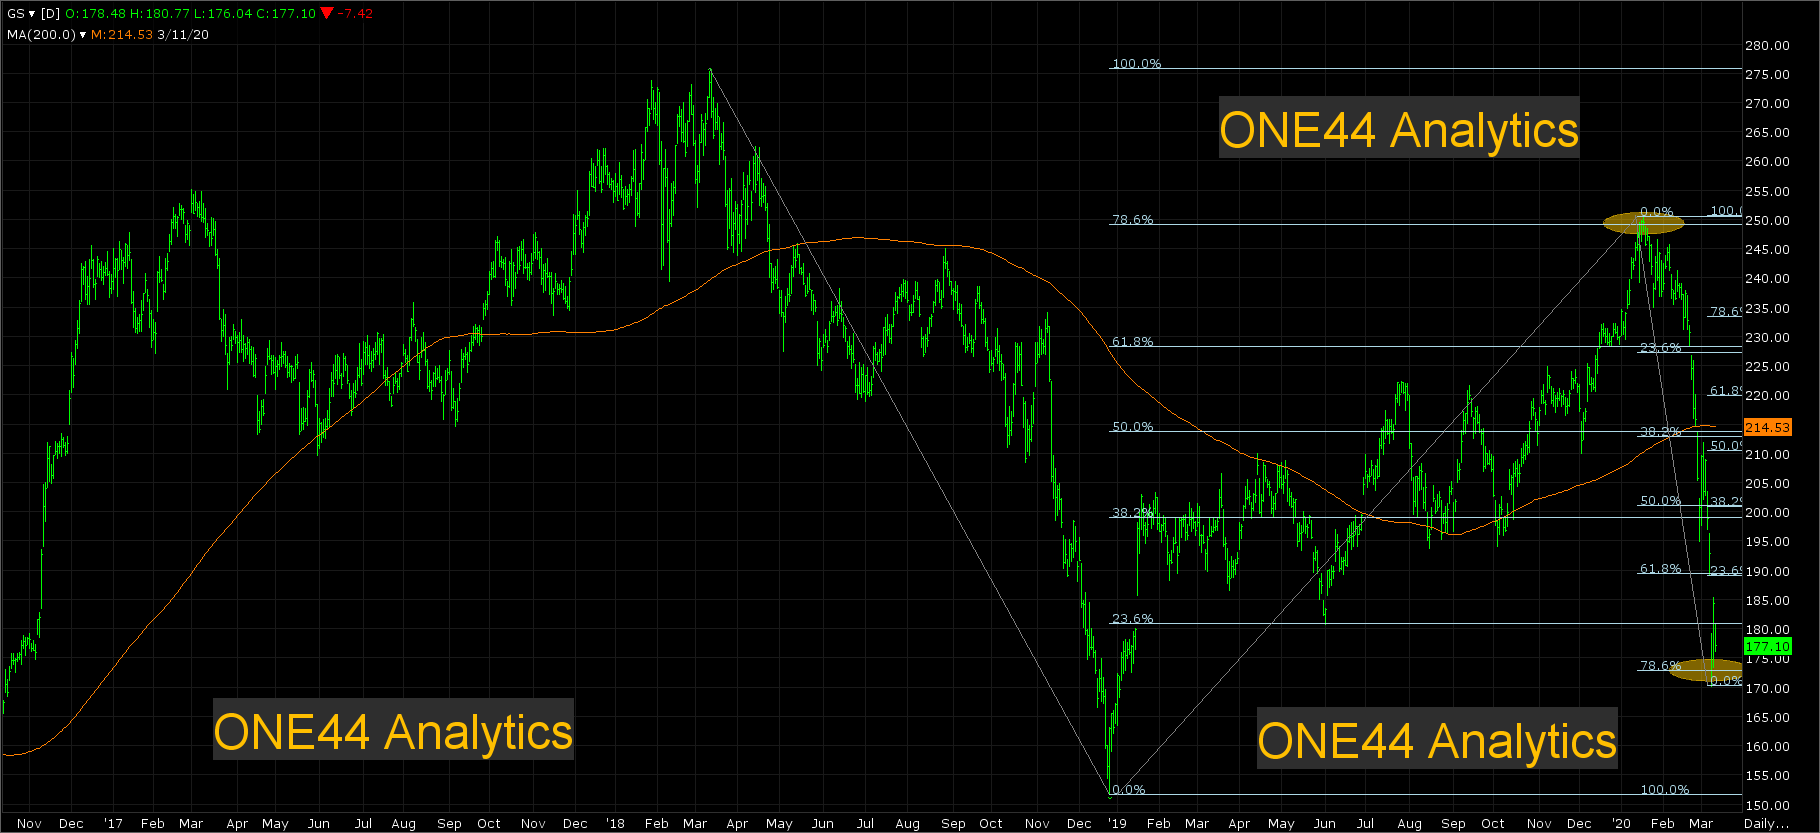
The second is GS and the 78.6% rule,
The high in GS before the big sell off was 78.6% back of the all-time high and the Dec. 2018 low, this level was 249.00. The 78.6% rule tells us to look for 78.6% of the move it just came from and this level is 172.50. you can use this as the long term swing point now. Above it, because it is 78.6% we should be looking 78.6% back the other way and this is 233.00, again this can take awhile, so we will watch all the retracements on the way up to check the markets strength. The first is 38.2% back up at 201.00, failing to get above it should send it back to the lows. On a failure to hold the 172.50 look for 61.8% of the 2009 low and the all-time high, this level is 134.00.