Marathon Digital Holding Inc. and the use of the ONE44 Fibonacci rules and guidelines.
ONE44 Analytics where the analysis is concise and to the point
Our goal is to not only give you actionable information, but to help you understand why we think this is happening based on pure price analysis with Fibonacci retracements, that we believe are the underlying structure of all markets and Gann squares.
Here is a quick set of guidelines for the Fibonacci retracements to help with this article. You can find all the rules/guidelines and examples on any deviations from these four basic rules on our website.
1) The Golden rule, any market that is going to continue the current trend must hold 38.2% and a new high/low should follow.
2) Markets that are extremely strong/weak will only go 23.6% and a new high/low should follow. Typically a runaway market.
3) The 61.8% rule is, any market that holds 61.8% should go 61.8% of where it just came from. Usual happens when a market is directionless, or in a consolidation period.
4) The 78.6% rule is, any market that holds 78.6% should go 78.6% of where it just came from. This is also where a lot of Bull markets end and start.
Charts are courtesy of Barchart
This article will cover Marathon Digital Holding Inc. and the use of the ONE44 Fibonacci rules and guidelines.
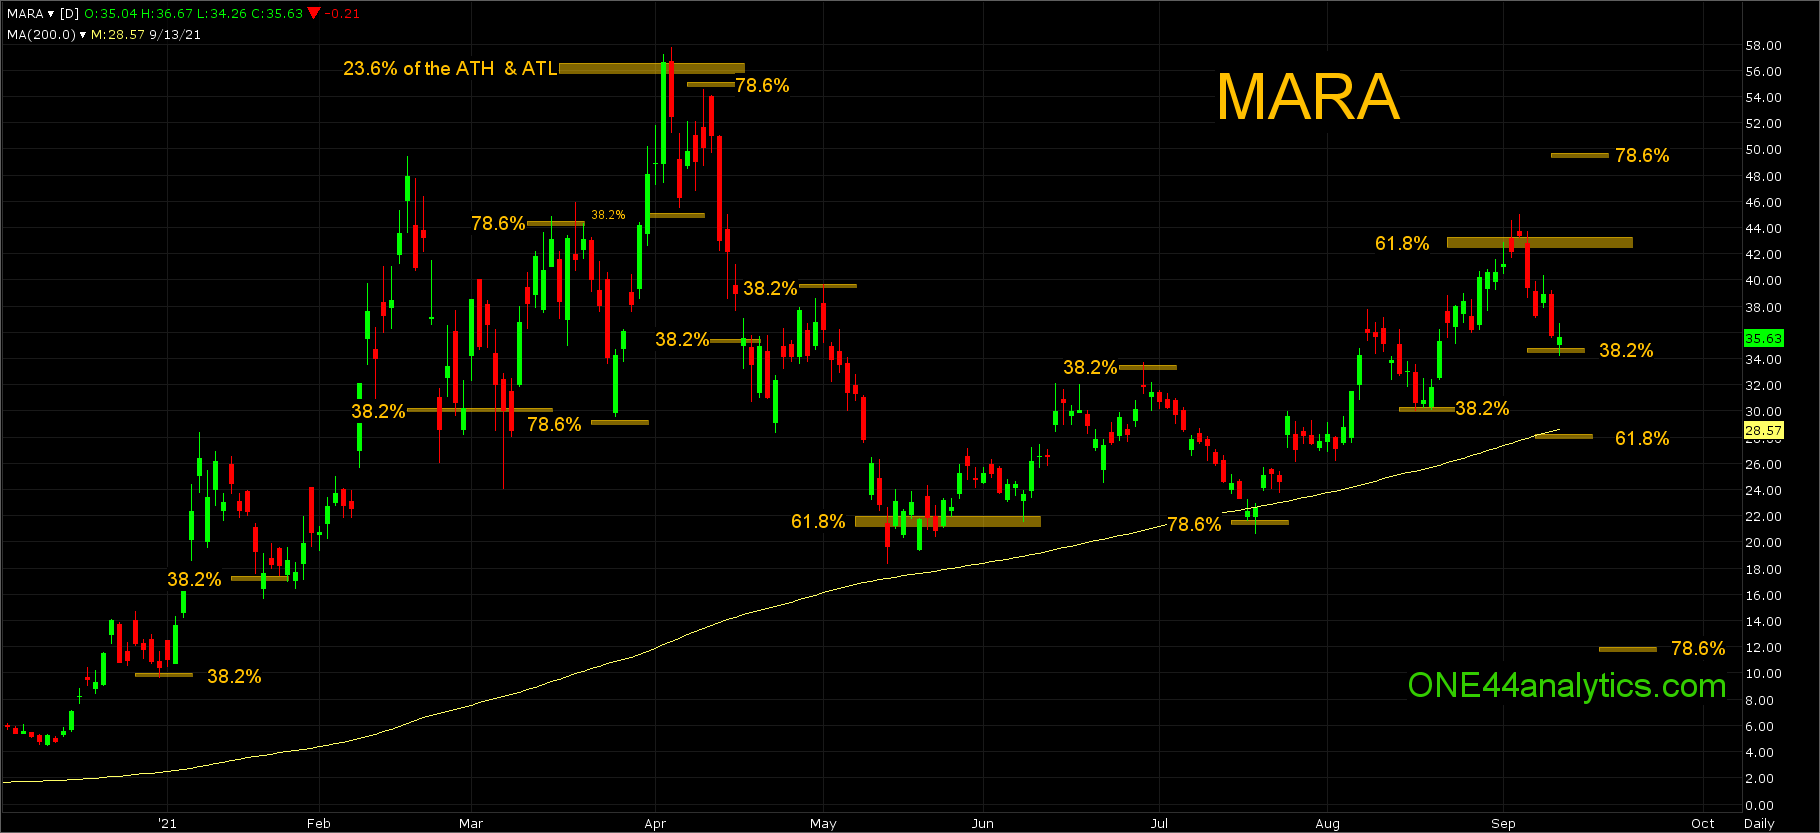
Going back to the rally that started in November of 2020, the first setback held 38.2% on 12/31/20, using the 38.2% rule we should look for new highs to keep the trend intact, this did happen and the next setback held 38.2% of the new high on 1/21/21. Again we were looking for new highs. This rally took it to 49.40 on 2/17/21. The break from there took it down to and through 38.2% on 2/23/21, it did have one close below it, which is acceptable. It did this again on 3/8/21. The rally from there should have taken it to new high, however it failed to make the new high and hit 78.6% on 3/15/21.
The 78.6% rule says it should go for 78.6% of where it just came from and this was done on 3/25/21. This was also back into 38.2% of the move up and what it needs to hold to keep the longer term trend positive. The next rally shows how important it is to know all the long term levels even though it is holding 38.2% below. The high for the year so far hit 23.6% of the ATH and ATL, this was 55.75 on 4/5/21. A break from there should take it to retest the lows.
Now back to the shorter term levels, two days later it held 38.2% back to the low on 3/25/21. The rally from there failed to make the new high and hit 78.6% on 4/12/21. As mentioned above 78.6% is where a lot of Bull runs end. The break from there went through 38.2% of the move up at 35.75, turning the shorter term negative. The next rally on 5/3/21 hit 38.2% and that break took it to 61.8% on 5/13/21. It did have one close below. The longer term target on a rally from 61.8% is 61.8% of where it just came from and this is 42.50 and this was hit on 9/1/21.
Before they hit the 61.8% target, the first rally went 38.2% back to the years high on 6/29/21, this should have sent them to new lows, however they held 78.5% of the current rally on 7/20/21 and was back into 61.8% of the bigger move at 22.00. The target after hitting 38.2% on 6/29/21 and not making a new low would be 61.8% of the same move, another reason for the 61.8% target.
The next setback after taking out 38.2% at 33.00 went to 38.2% of the current rally on 8/17/21. This sent it up to the 61.8% target hit on 9/1/21. The target on a break from 61.8% is 61.8% the other way and this is 28.25. As always we watch all the retracements on any move to see just how weak, or strong the market is and if all they can do is go 38.2% at 34.70 the current short term trend remains positive and you can look for it to take out 61.8% above and go for 78.6% at 49.50.
On a failure to hold 61.8% at 28.25 and the 200 day moving average at 28.57 look for 78.6% of the move up at 12.00, this level will still be possible until it can take out 23.6% back to the ATH at 55.75. Provided the current break holds 38.2% at 34.70, the next rally could take it up there.
Just by looking at the chart alone you can see how important the Fibonacci retracements are and with the ONE44 rules and guideline you have an idea of what is possible from those levels, if they hold, or not.
If you have a market you would like to see a post about on Barchart based on the ONE44 Fibonacci rules and guidelines send the ticker symbol to [email protected]
Emails only and we will try to get as many of them posted as possible depending on the response.