Natural Gas and the Natural flow of markets

Natural Gas
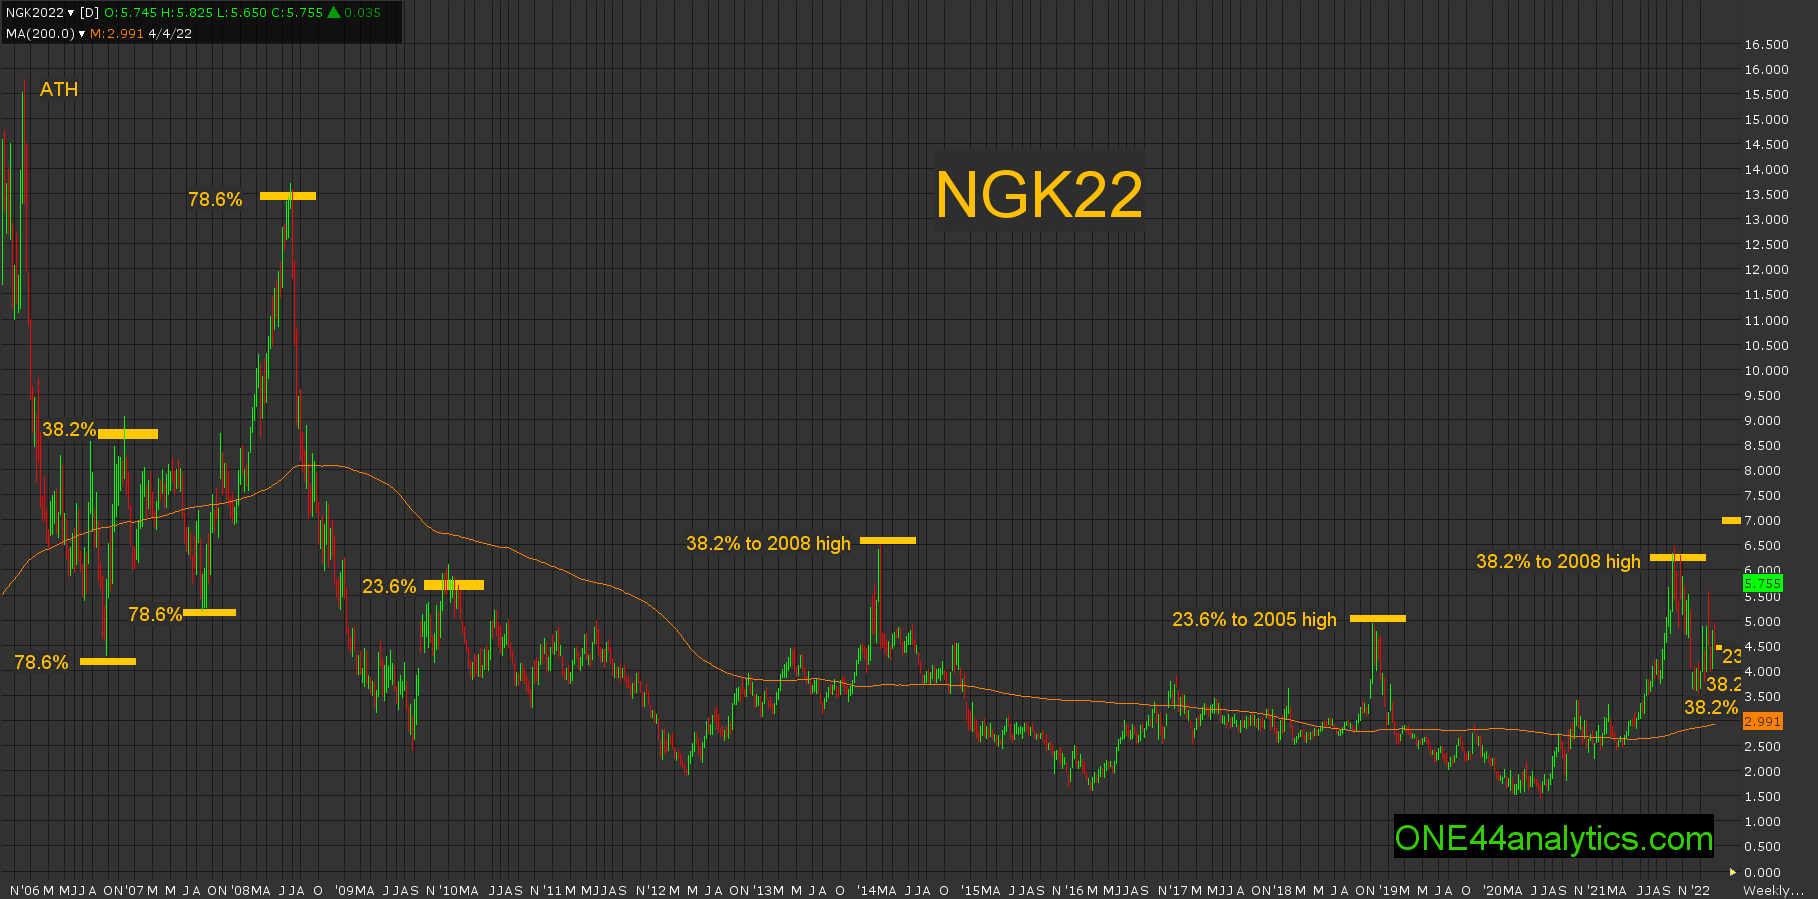
In this post we are going to start with the weekly nearby chart to show what has happened since the ATH in 2005 and then bring it up to the daily chart, so you can see how important the Fibonacci retracements are when following the ONE44 rules and guidelines.
The retracements from the two most important highs, one being the ATH and then the retest of that in 2008 have marked the spike highs in 2010, 2014, 2018 and 2021.
Going back to 2010 the high was 23.6% back to the ATH and following the 23.6% rule,
Extremely strong/weak markets will only go back 23.6%. This is Typically a runaway market.
It should also go for a new low/high to keep the current trend intact. This target was completed with the 2012 low. The next major rally went right to 38.2% back to the 2008 high in 2014 and following the 38.2% rule,
38.2% is the single most important retracement and is the level we use for the "Golden Rule". This rule being, " any market that is going to keep it's current trend must hold 38.2%". As long as it does the trend will continue and it should make new highs/lows from that retracement.
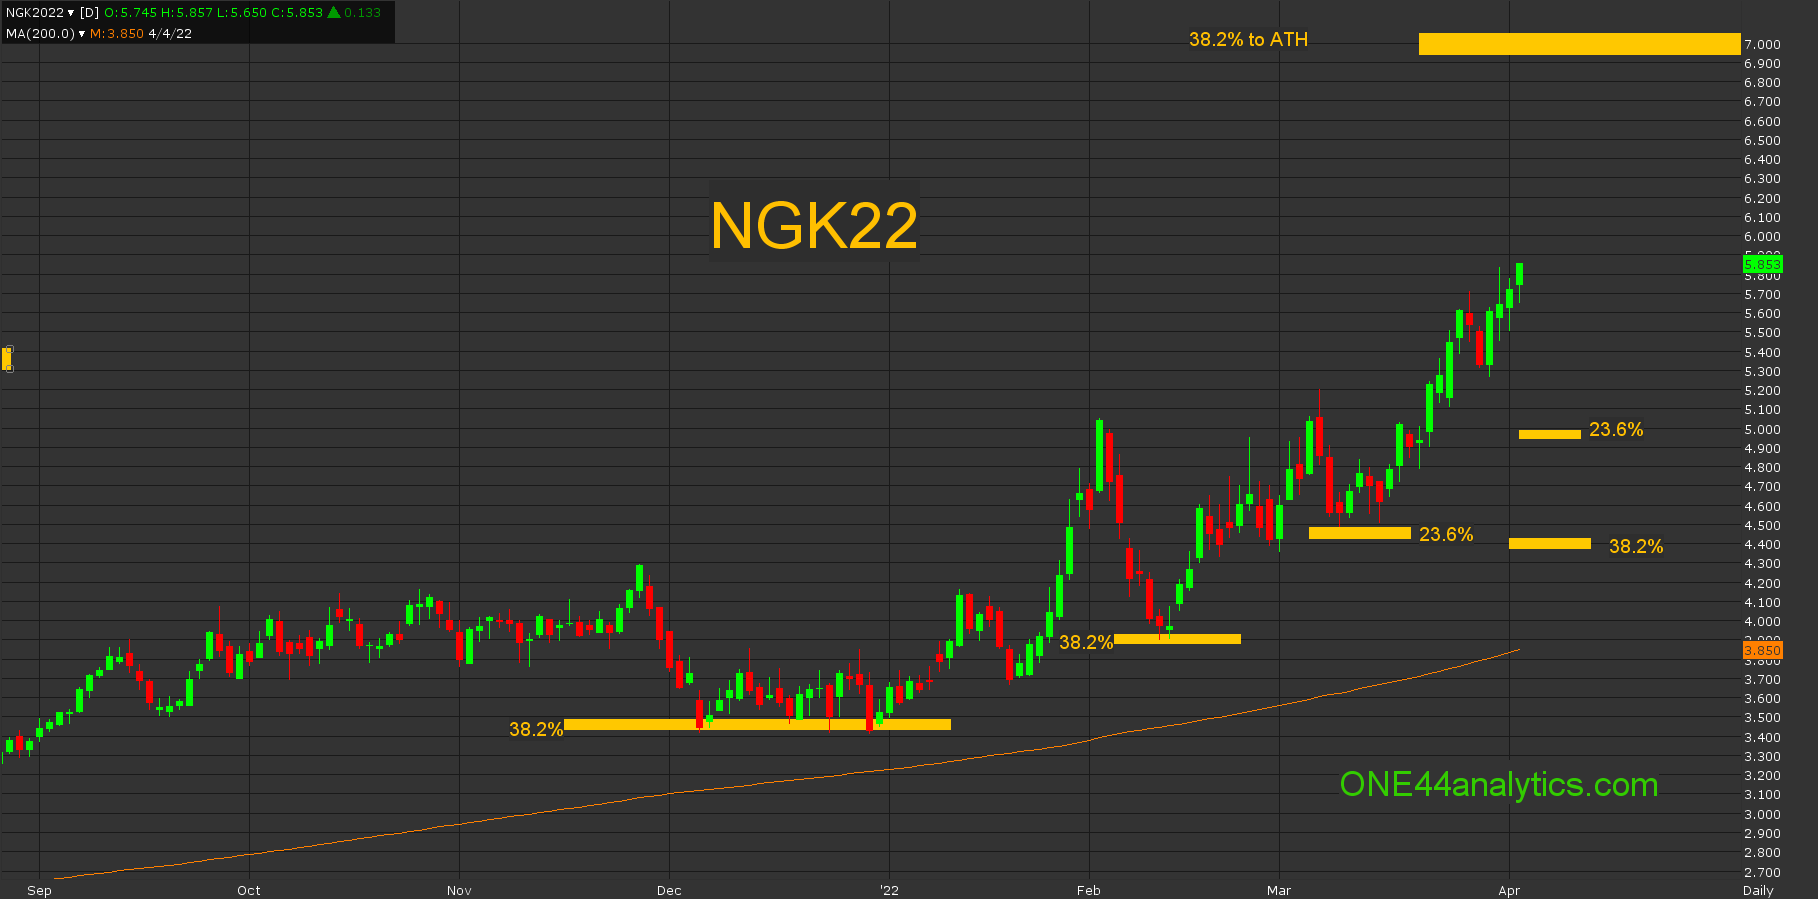
Here too, the market went on to make a new low for the move that ended in 2016. The rally from there went to 23.6% back to the ATH in 2018. This also went on to make new lows in 2020. The rally from the 2020 low took it to 38.2% back to the 2008 high, the break from this high has failed to make a new low so far. As you can see every major top in the last 17 years has hit a Fibonacci retracement and now I want to go to the daily chart to show you how the retracements have been working on the support side of this current rally.
Starting with the break from the 11/26/21 high it went to 38.2% back to the 2020 low, by holding this level it tells us the short term trend is now positive and the new highs for the move followed. The second setback from the 2/2/22 high also held 38.2% back to the 2020 low on 2/10/22 and went on to new highs. The next setback from the 3/7/22 high could only go 23.6% back to the 2020 low telling us "This is Typically a runaway market."
What to look for now.
As long as the market holds 38.2% that is currently 4.42 the uptrend continues and if it can only get back to 23.6% at 4.99 the market remains extremely positive. Going back to the weekly chart the upside target will be 38.2% back to the ATH at 6.95. I hope this shows you how useful the Fibonacci retracements can be when following the ONE44 rules and guidelines. Below is our new video explaining more about how to use them, this one is in Grains. Even if you do not trade Grains it is worth watching as the rules and guidelines are the same for all markets. As we believe "The Fibonacci retracements are the Underlying Structure of ALL markets"
Sign up for our Free newsletter here.