New levels for ZWH22, ZCH22 and ZSF22
ONE44 Analytics where the analysis is concise and to the point
Our goal is to not only give you actionable information, but to help you understand why we think this is happening based on pure price analysis with Fibonacci retracements, that we believe are the underlying structure of all markets and Gann squares.
For the ONE44 Fibonacci rules and guidelines to help with this article, go here.
Charts are courtesy of Barchart.com
Grains
All the charts have moved into ZCH22, ZWH22 and ZSF22, this includes the Daily, Hourly Fibonacci and Law of Vibration charts.
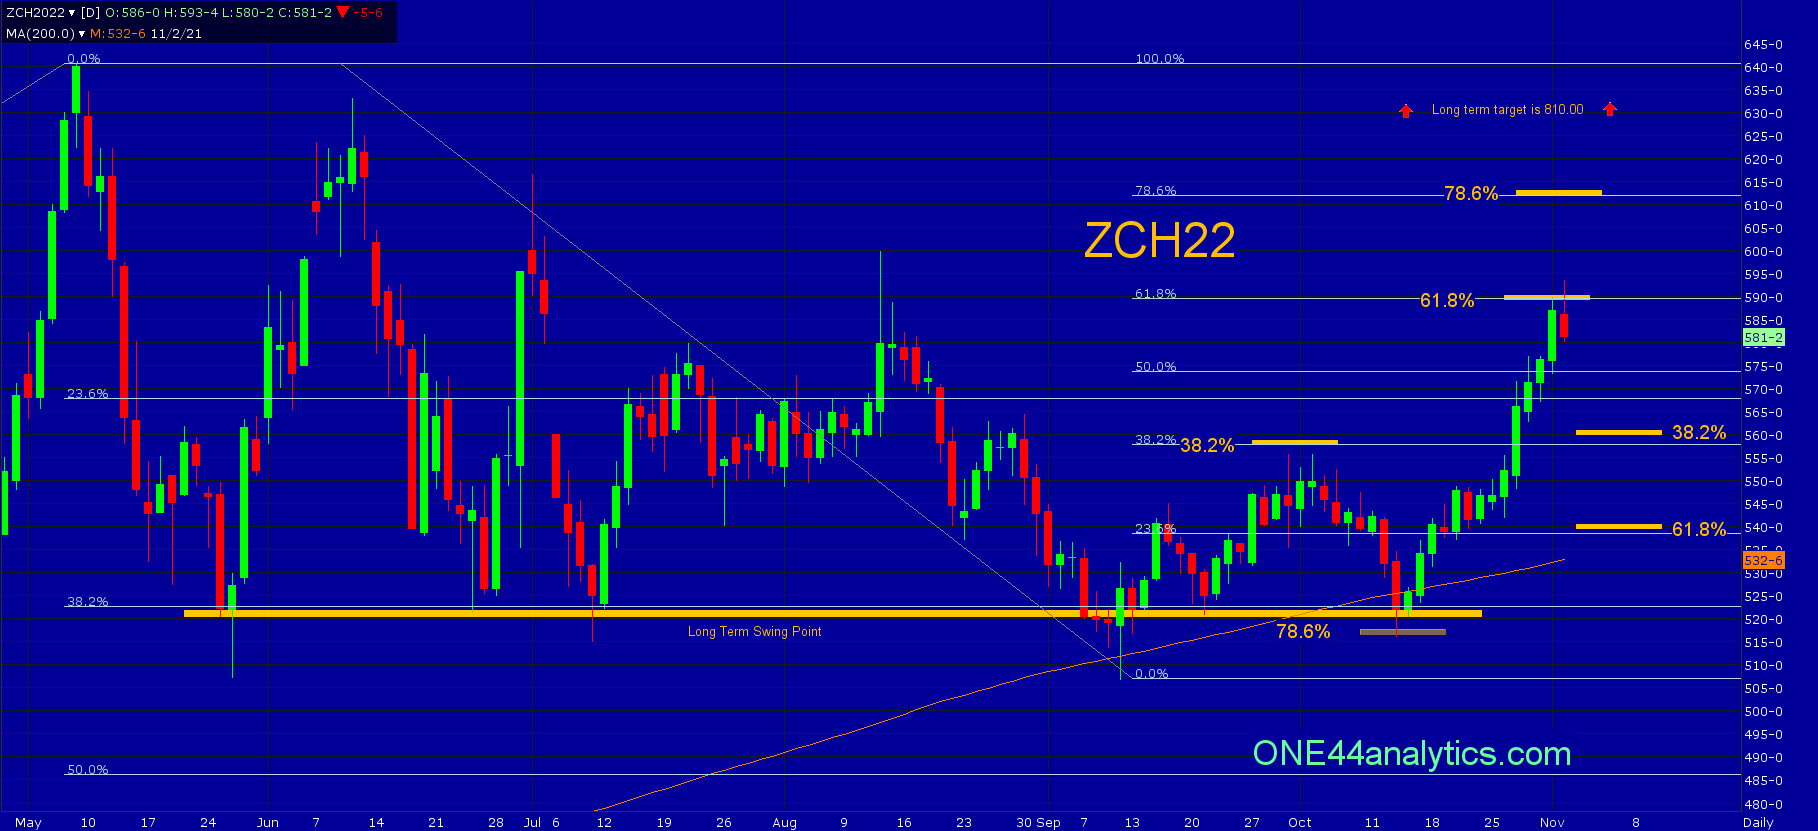
Corn
This was from our last update on 10/28/21,
"The high on 9/30/21 was just shy of 38.2% at 550.00, using the ONE44 Fibonacci rules and guidelines we should have been looking for new lows to keep the trend negative and any time it fails to make that new low the target becomes 61.8% (585.00) of the same move. It did have one solid close below the 518.00 long term swing point, however it hit 78.6% at 507.00. Following the 78.6% rule we know,
Any market that hits 78.6% should go 78.6% back the other way. This is also where a lot of Bull markets end and start.
So, to start it should have gone to 540.00 to complete the 78.6% target and the second part of the rule tells us this could be the start of a new Bull run and we can look for even more than the 585.00 target based on the 38.2% rule."
Today,
Corn has now hit the 61.8% (585.00) target based on the guidelines mentioned above. Following the ONE44 Fibonacci 61.8% rule, we should be looking for a setback to 61.8% of where it just came from and this will be 540.00. As always we will watch all the retracements to see just how weak, or strong the market is, regardless of that target. Only being able to get to 38.2% at 561.00 would keep the short term trend positive and you can look for 78.6% above at 612.00.
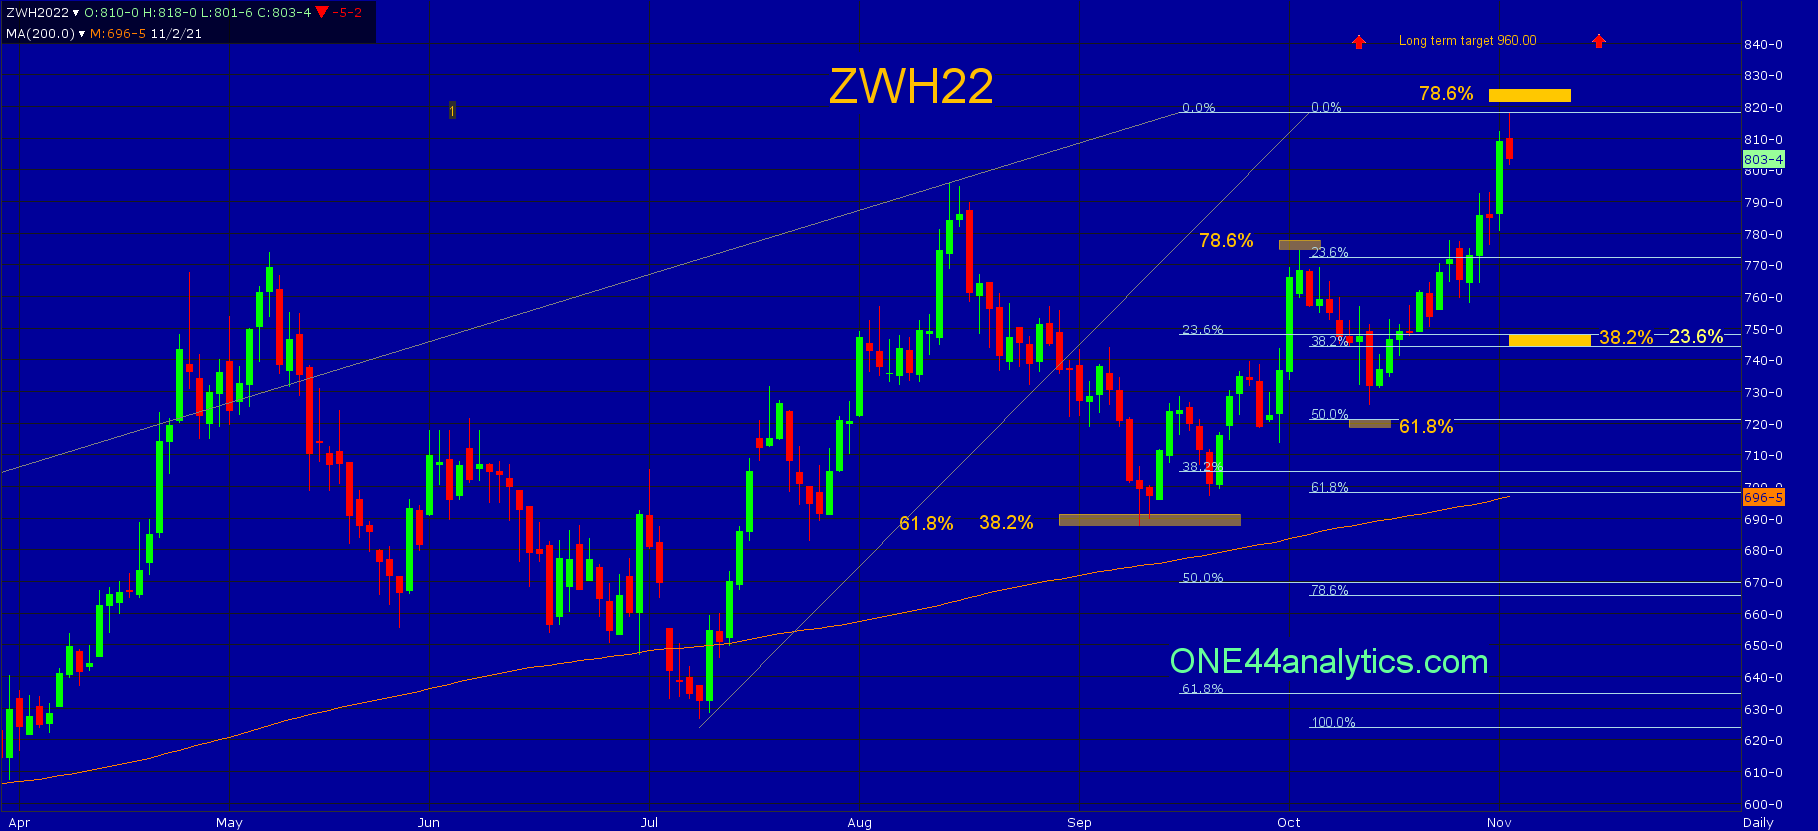
Wheat
Wheat remains the strongest of the 3 markets. The setback from the 78.6% level at 775.00 could not even get back to 61.8% in the short term picture. The low on 9/10/21 held 61.8% back to the 7/9/21 low and 38.2% back to the 2020 low, this area was 691.00 to 688.00 and that took it to new highs as it should. The level that can set this market back is 78.6% to the 2012 high, this is 820.00. On any break from this area look for 748.00 to 745.00, this area is 38.2% back to the 7/9/21 low and 23.6% back to the 2020 low. Holding these levels will keep the long term trend extremely positive and you can look for the long term target of 960.00.
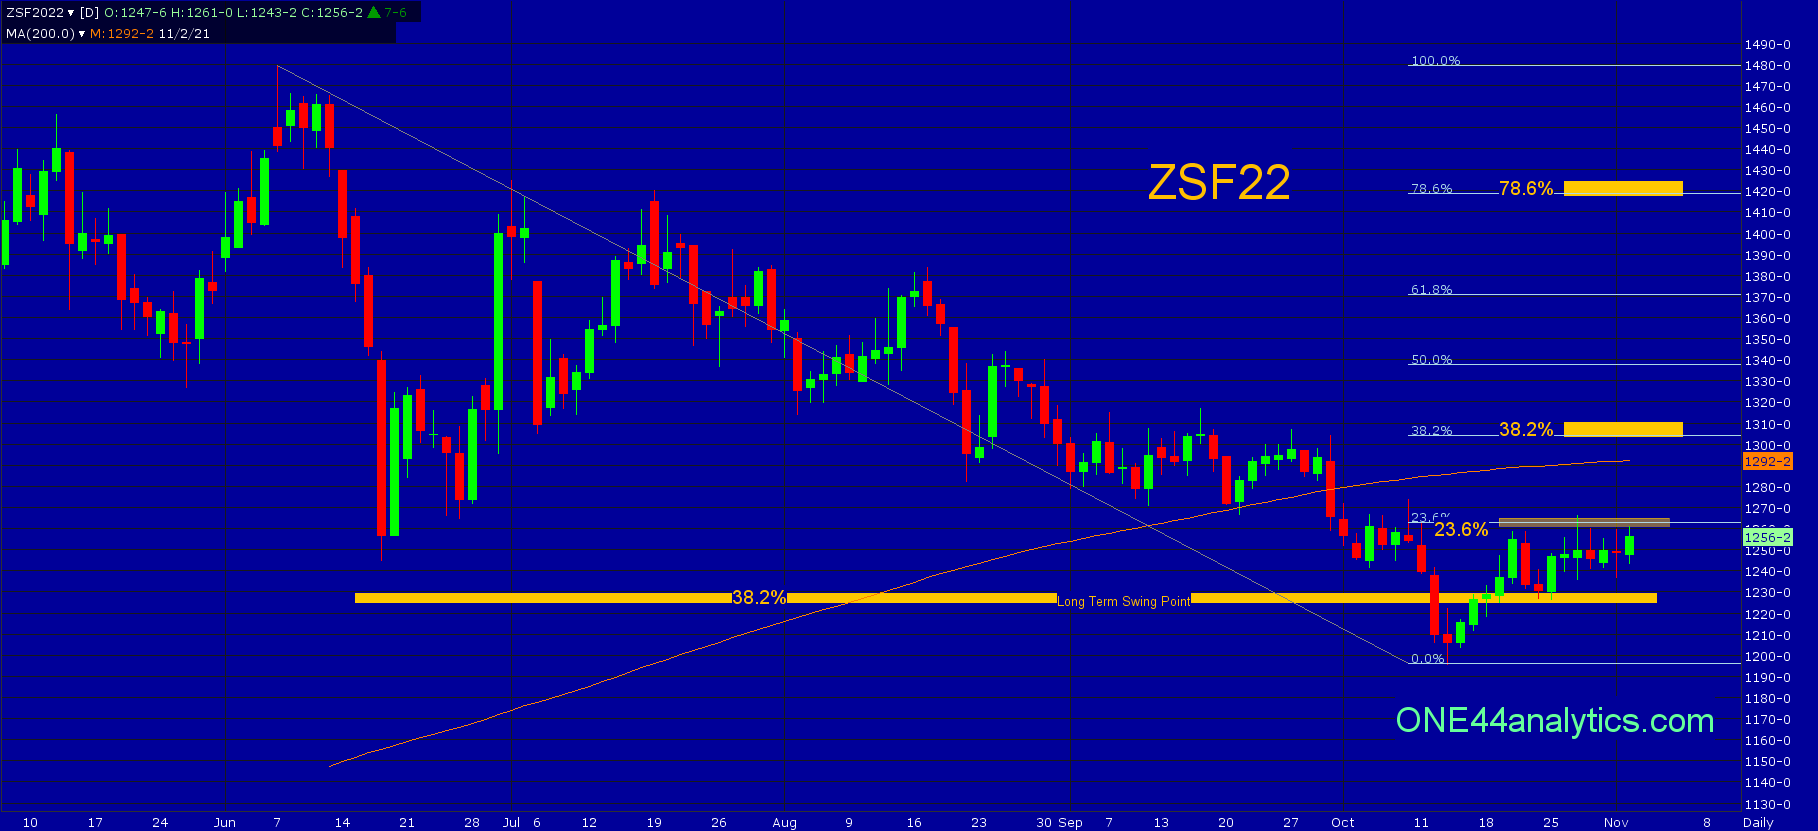
Soybeans
Soybeans have traded in a tight range for the last 2 weeks between 1229.00, the long term swing point and 1263.00, 23.6% back to the contract high. Being back above the long term swing is a good thing, however it will have to get above 38.2% at 1305.00 to turn the short term trend positive. Provided they can look for 78.6% at 1420.00. Failing to get above 1305.00 after getting back above the long term swing point is not a good sign and with a couple solid closes below 1224.00 you can look for 61.8% of the long term trend at 1080.00.
As you can see on the new charts we have only put in the most recent retracements, you can find the previous charts with all of the retracements in our past posts on the website.
Sign up for our Free newsletter here.
FULL RISK DISCLOSURE: Futures trading contains substantial risk and is not for every investor. An investor could potentially lose all or more than the initial investment. Commission Rule 4.41(b)(1)(I) hypothetical or simulated performance results have certain inherent limitations. Unlike an actual performance record, simulated results do not represent actual trading. Also, since the trades have not actually been executed, the results may have under- or over-compensated for the impact, if any, of certain market factors, such as lack of liquidity. Simulated trading programs in general are also subject to the fact that they are designed with the benefit of hindsight. No representation is being made that any account will or is likely to achieve profits or losses similar to those shown. Past performance is not necessarily indicative of future results.