NGV21 A Viewer Request
ONE44 Analytics where the analysis is concise and to the point
Our goal is to not only give you actionable information, but to help you understand why we think this is happening based on pure price analysis with Fibonacci retracements, that we believe are the underlying structure of all markets and Gann squares.
Viewer request
This article will cover the long and short term analysis on Natural Gas using the ONE44 Fibonacci rules and guidelines
Here is a quick set of guidelines for the Fibonacci retracements to help with this article. You can find all the rules/guidelines and examples on any deviations from these four basic rules on our website.
1) The Golden rule, any market that is going to continue the current trend must hold 38.2% and a new high/low should follow.
2) Markets that are extremely strong/weak will only go 23.6% and a new high/low should follow. Typically a runaway market.
3) The 61.8% rule is, any market that holds 61.8% should go 61.8% of where it just came from. Usual happens when a market is directionless, or in a consolidation period.
4) The 78.6% rule is, any market that holds 78.6% should go 78.6% of where it just came from. This is also where a lot of Bull markets end and start.
Charts are courtesy of Barchart.com
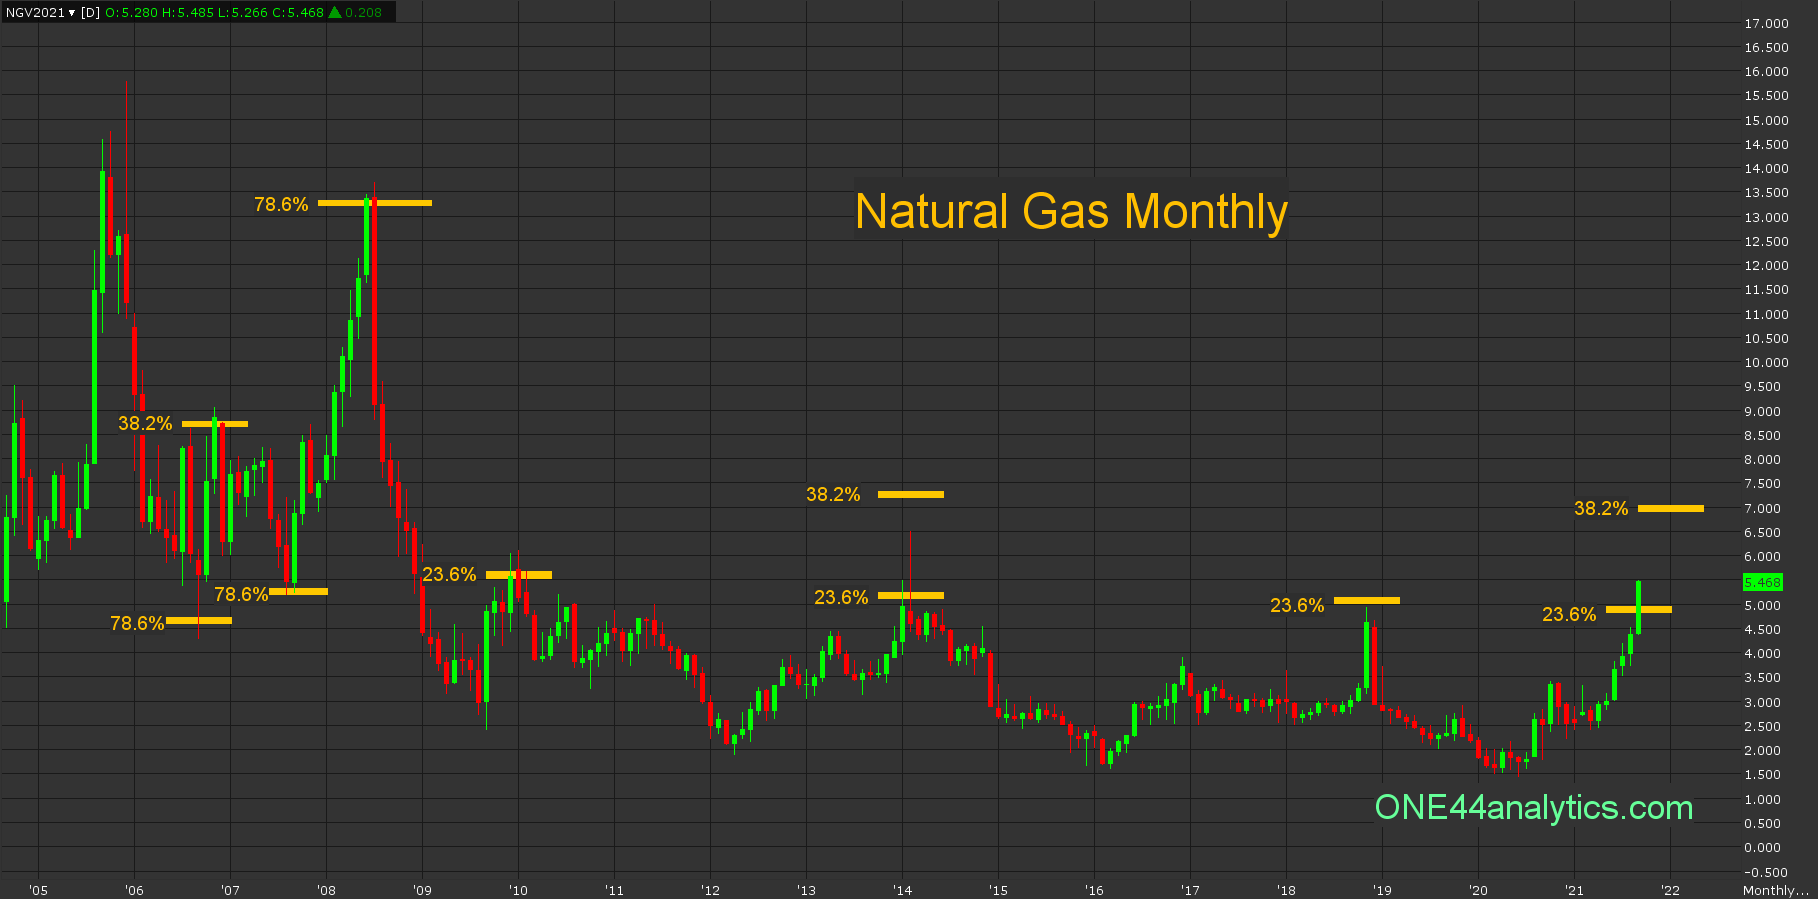
Taking a look at the long term view first on a monthly chart we will start with the break from the ATH in 2005. The bottom of that break hit 78.6% of the ATH and ATL in September of 2006. Using the guidelines above the long term target on a rally from here would be 78.6% the other way and this is 13.23. Even with that being the long term target we have to watch all the retracements on any move to see just how strong, or weak the market is.
The rally from the 2006 low could only get back to 38.2% in November of 2006, this was 8.70. Using the 38.2% rule, we would be looking for a new low to keep the trend negative. Watching all the retracements on the break from 38.2% we see that it not only did not make a new low, but held 78.6% at 5.35 in August of 2007. Taking part of rule #4 "This is also where a lot of Bull markets end and start." you can see this is exactly what happened.
The eventual high on that rally hit the 78.6% long term target of 78.6% at 13.23. The break was swift and you would have had to look at the daily and even hourly chart using the same rules and guidelines to see how there would have been other areas to short the move down, just as I will show you how there were other levels to get long in the sharp rally happening today.
The next three attempts to rally in 2010, 2014 and 2018 all held 23.6% back to the ATH and led to new lows as it should to keep the trend negative. The 2014 rally did spike above 23.6% , but failed to get above 38.2% which was needed to turn the long term trend positive.
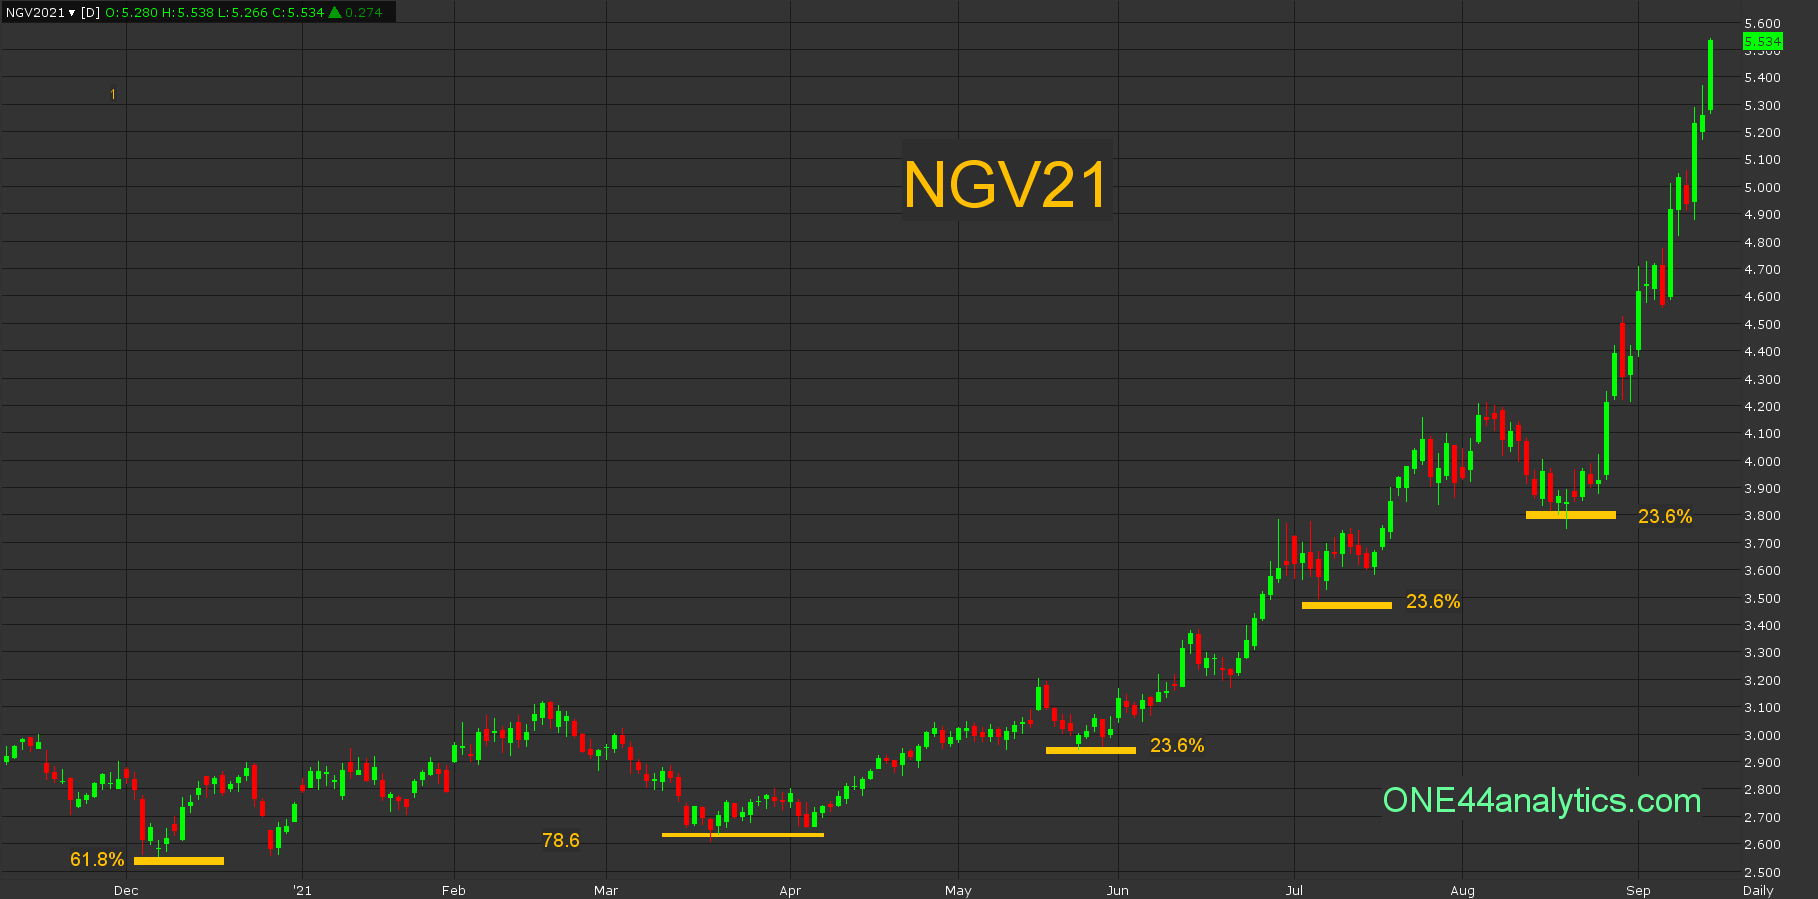
Here is a quick scan of the lows on the daily chart. The low on 12/7/20 held 61.8% and on 3/18/21 it held 78.6% before going on a huge rally. The next three setbacks on 5/24/21, 7/7/21 and 8/19/21 all held 23.6% of the 12/7/20 low at 61.8%. As part of the 23.6% states this is "Typically a runaway market".
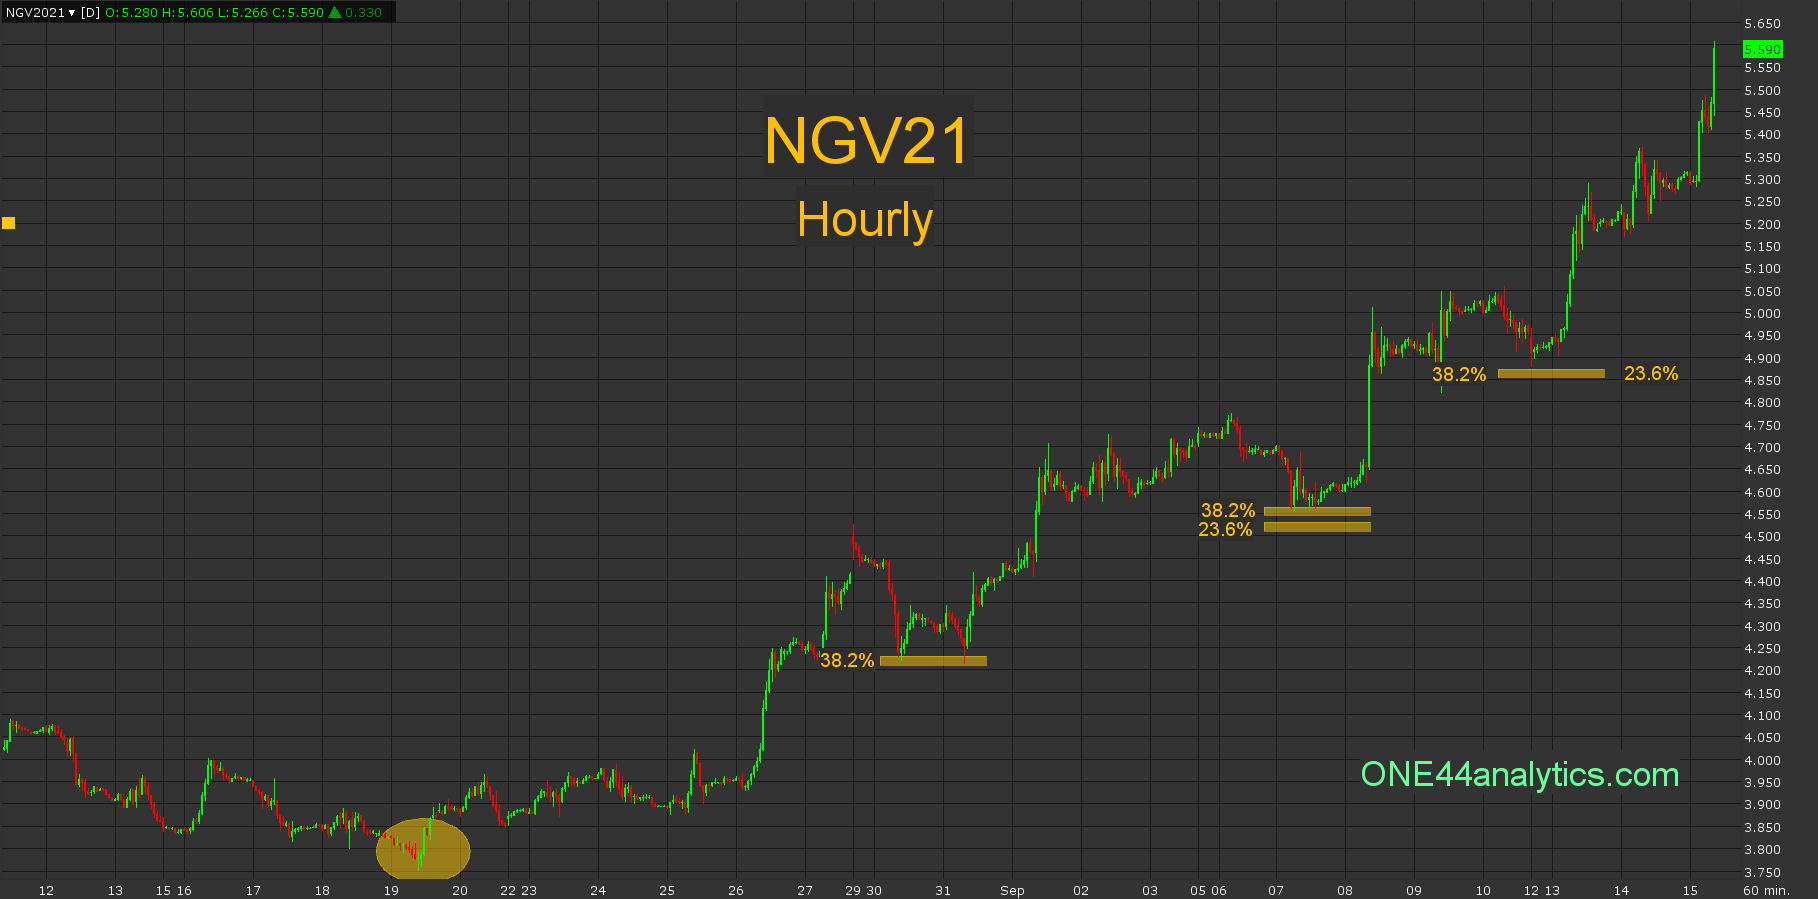
Now we will go over the most explosive part of the current rally from the 8/19/21 low using the hourly chart.
The first good setback from the 8/19/21 low held 38.2% of the rally on the 30th and 31st. The next setback could not even get to 23.6% of the 8/19/21 low, however it did hold 38.2% back to the 30th low on 9/7/21. With the move getting even stronger we have to start retracing to the lows on 8/30 and 9/7 to get it to hit a retracement. The low on 9/12/21 was 23.6% and 38.2% to those lows.
The point of taking this from the macro to the micro view is to show how and why we believe that the Fibonacci retracements are the underlying structure of all markets.
Currently,
In the long term view you can use 5.17 (23.6% to the ATH) as the swing point, above it look for 38.2% to the ATH at 6.95. The long term trend will not turn positive until this level is taken out. With a solid close back below 5.17 look for 38.2% of the current rally at 4.00, if this level is taken out a longer term top should be in and move down to 78.6% at 2.35 can happen.
We are looking for your input, if there is a stock, or futures market you would like to see us do Fibonacci analysis on, email the ticker symbol to [email protected]
We will update these on the ONE44 website along with posting them on Barchart.com.
Sign up for our Free newsletter here.
FULL RISK DISCLOSURE: Futures trading contains substantial risk and is not for every investor. An investor could potentially lose all or more than the initial investment. Commission Rule 4.41(b)(1)(I) hypothetical or simulated performance results have certain inherent limitations. Unlike an actual performance record, simulated results do not represent actual trading. Also, since the trades have not actually been executed, the results may have under- or over-compensated for the impact, if any, of certain market factors, such as lack of liquidity. Simulated trading programs in general are also subject to the fact that they are designed with the benefit of hindsight. No representation is being made that any account will or is likely to achieve profits or losses similar to those shown. Past performance is not necessarily indicative of future results.