ONE44 Fibonacci Chart of the Week
We believe that the Fibonacci retracements are the underlying structure of all markets and in these weekly examples we give educational and actionable information.
All of the rules/guidelines along with other examples can be found here, https://www.one44analytics.com/fibonacci-retracements-rules/
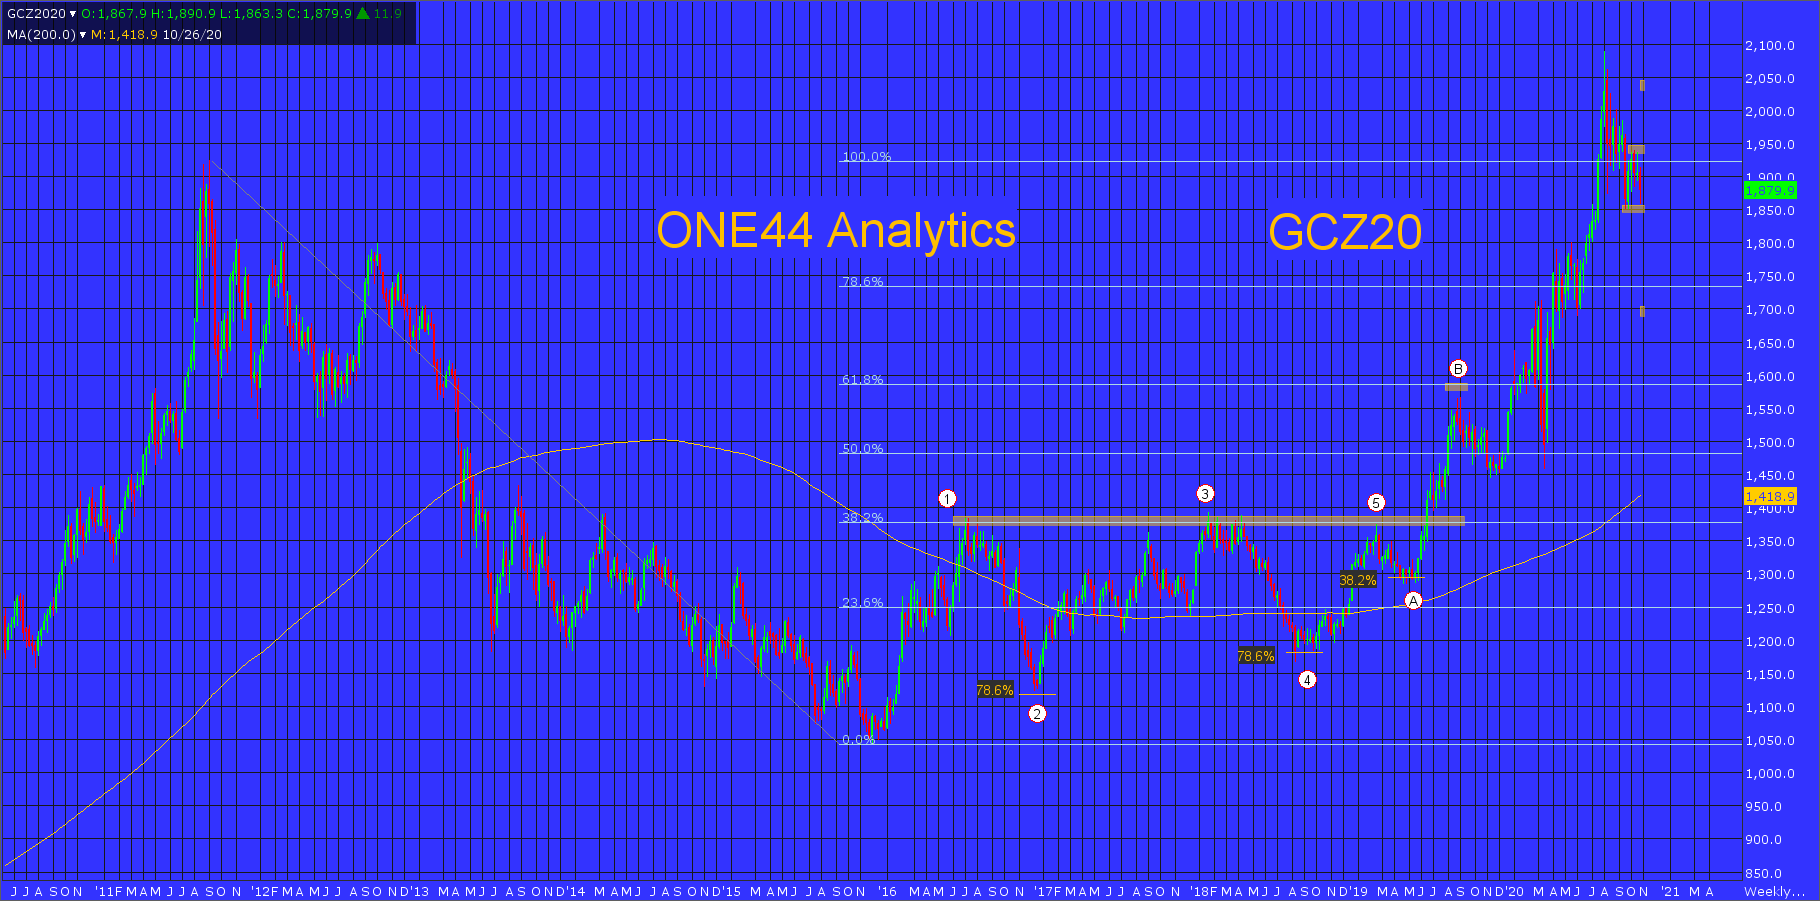
Gold/GCZ20
To start we will go back to the 2016 low on a Weekly chart. The rally from there, went back to 38.2% (1) to the all-time high.The 38.2% rule states that any market that is going to continue the current trend it has to stay below/above 38.2%. It should also go for a new high/low from it. A failure to do so will mean the current trend is over and you can look for 61.8% of the same move.
When you fail to make that new high/low a lot of times this will happen at 78.6% of the move.In this example the break from (1) 38.2% stopped at 78.6% (2) the rally from there went back to 38.2% (3) of the all-time high again. The break from there took it to 78.6% of the current rally (4), once again failing to make a new low and telling us to look for 61.8% back to the all-time high. They did hit 38.2% (5) again and this time the break could only go 38.2% (A) of the current rally telling us the market is getting stronger. The rally from (A) went to just below 61.8% (B) back to the all-time high. Now that we have seen how a market turns when it fails to make that new high/low from 38.2% and goes for 61.8% of the same move. We can now bring you up to date and see how the retracements have worked on this rally up to new all-time highs. For this we will use the Daily chart.
Now that we have seen how a market turns when it fails to make that new high/low from 38.2% and goes for 61.8% of the same move. We can now bring you up to date and see how the retracements have worked on this rally up to new all-time highs.
For this we will use the Daily chart.The break from 61.8% on the Weekly chart was only able to retrace 38.2% (1) of the current leg keeping this market very positive and this led to new highs. The big break in March of this year went right to 38.2% (2) of the 2015 low. From there it went on to new highs as it should after holding 38.2%. The setback after new highs could not even retrace 38.2% (3) of the March low keeping this market very positive. The break from the all-time high got down to 23.6% of the 2015 low and 38.2% of the March low (4). This area should send them up to new all-time highs, but as always, we watch all the retracements on move up. The rally went right to 38.2% (5) back to the all-time high.
What to watch for now,
They are now caught between two major retracements and could spend another few weeks between the levels of 1850.00 and 1942.00. Use 1850.00 as the swing point, above it look for the top end of the current trading range. With a couple solid closes below, look for the area of 1700.00 and 1690.00, this is 61.8% back to the March low and 38.2% back to the 2015 low. This is the area that must hold to keep the long term trend positive. With a couple solid closes above 1942.00 look for 78.6% back to the all-time high at 2040.00.

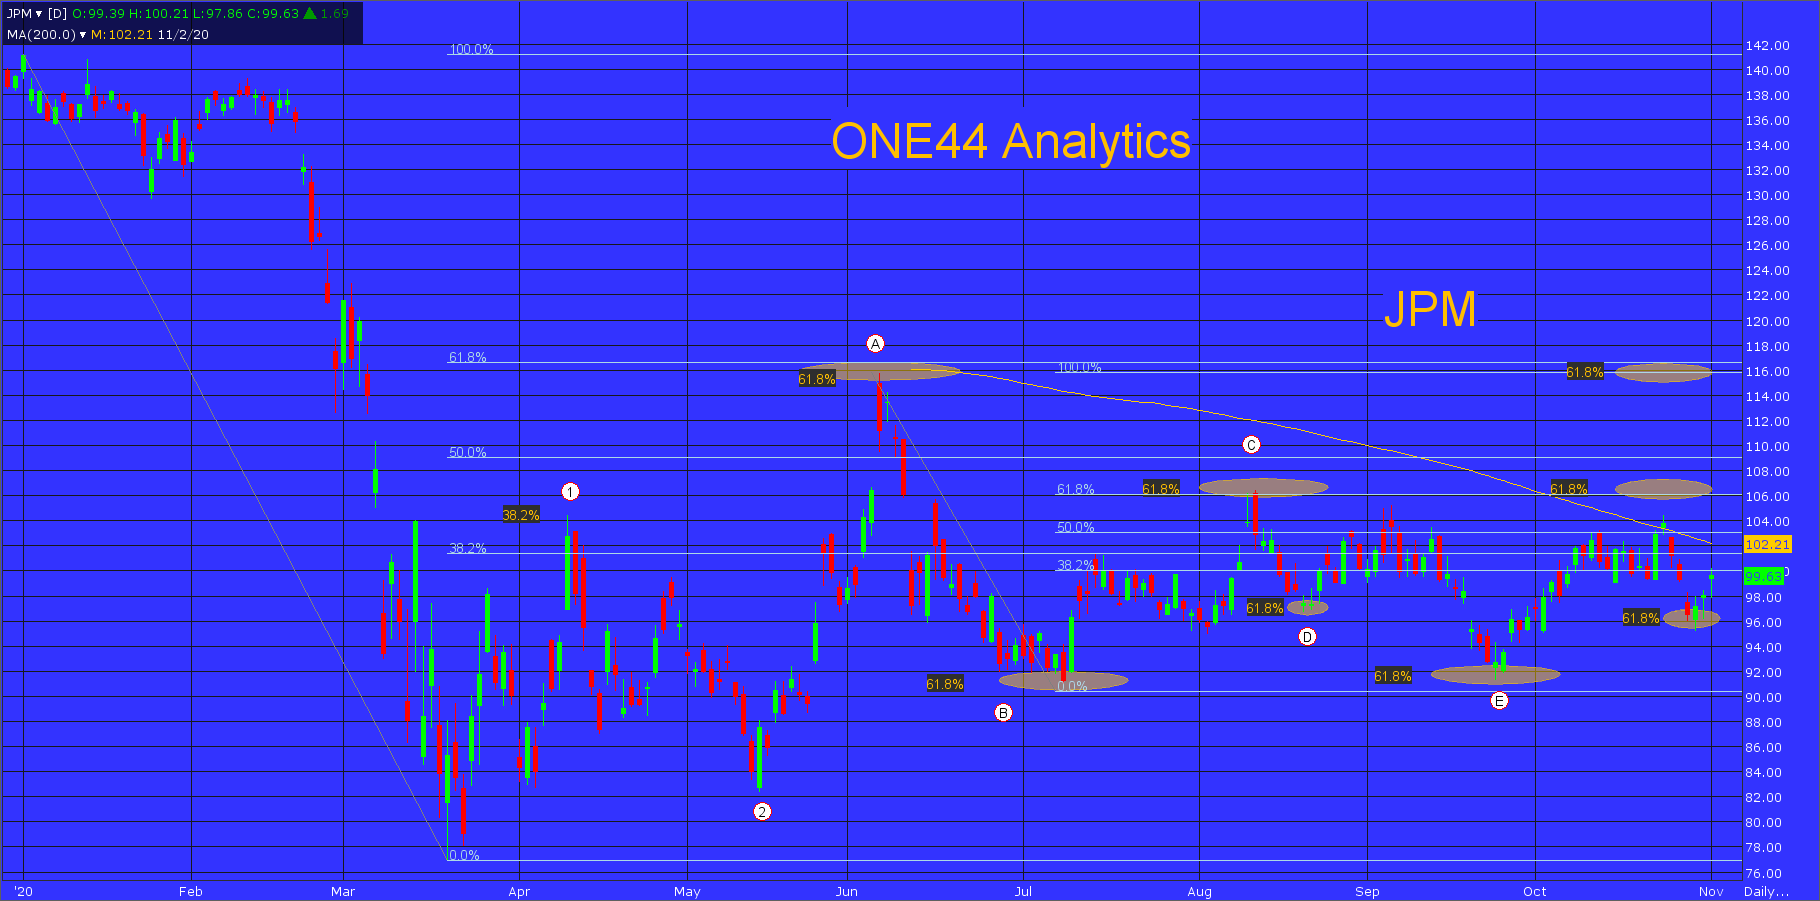
A quick update on the JPM Fibonacci Chart of the Week from 10/25/20
The actionable part of this update was,
Currently, until they can get a couple solid close's above 106.00 expect the trading range to continue and look for a break to 61.8% of the current rally at 96.00. Once they can get a couple solid close's above 106.00, look for 61.8% back to the all-time high again at 116.00.
As you can see on the chart below, they traded down to 61.8% at 96.00 and have already rallied $4 up to 100.21, keeping the trading range going.